Building a Kubernetes purple teaming lab
One of the challenges security practitioners face when learning and honing their trade is that production systems carry production-level risk. No matter how well intentions are documented and communicated, running security tooling against production systems is always fraught with danger and risk. Any kind of testing on production systems can potentially lead to system disruptions, policy violations and other unpleasant events.
In order to learn new techniques, or even refine existing ones, many security-minded folks will reach for a home lab or an isolated cloud environment. Indeed, when it comes to Windows security research and threat emulation, it is pretty straightforward to spin up and configure a small AD lab environment with dedicated hosts for carrying out and monitoring security scenarios.
However, what about containerized environments? What if you are trying to better understand how malicious threat actors can target Kubernetes workloads? What telemetry does a containerized attack generate?
In this post, we will walk through how to spin up a local Kubernetes cluster (minikube), install and configure telemetry, and then execute a handful of offensive security scenarios to test our telemetry collection. All of this will be done in the context of what is known as “purple teaming.”
What is purple teaming?
Before we get started, let’s first define what we mean by “purple teaming.” Purple teaming engagements and exercises can come in many flavors and may lean more to one side of the red-blue spectrum than the other, depending on how the exercise is laid out and who the recipient of the engagement is.
In general however, purple teaming is the dynamic of collaboratively attacking a system, checking the results of the attack, tracking the related metrics and then iterating; all with the goal of improving system security, response and resiliency.
Tooling overview
The following tools will be installed and configured on our VM for the purposes of this post:
| Tool | Function |
|---|---|
| Ubuntu 20.04 VM | Host operating system for entire setup |
| Docker | Container runtime for Kubernetes and Vectr |
| Minikube | Local Kubernetes cluster deployment |
| Sumo Logic | Cloud monitoring and telemetry analysis |
| Auditd + Laurel | Host-level logging with JSON transformation |
| Vectr | Purple teaming activity tracking |
Virtual machine setup
The first step will be to spin up a virtual machine. We will be using Ubuntu 20.04 in this post.
If you have access to an old computer, or a hypervisor environment, you are free to use physical hardware as well. For our purposes, we will be deploying a virtual machine on a dedicated laptop.
Docker Install
Documentation for installing Docker can be found at https://docs.docker.com/engine/install/ubuntu/
sudo apt-get update
sudo apt-get install ca-certificates curl gnupg

sudo install -m 0755 -d /etc/apt/keyrings
curl -fsSL https://download.docker.com/linux/ubuntu/gpg | sudo gpg --dearmor -o /etc/apt/keyrings/docker.gpg
sudo chmod a+r /etc/apt/keyrings/docker.gpg

echo "deb [arch=$(dpkg --print-architecture) signed-by=/etc/apt/keyrings/docker.gpg] https://download.docker.com/linux/ubuntu $(. /etc/os-release && echo "$VERSION_CODENAME") stable" | sudo tee /etc/apt/sources.list.d/docker.list > /dev/null

apt-get update
sudo apt-get install docker-ce docker-ce-cli containerd.io docker-buildx-plugin docker-compose-plugin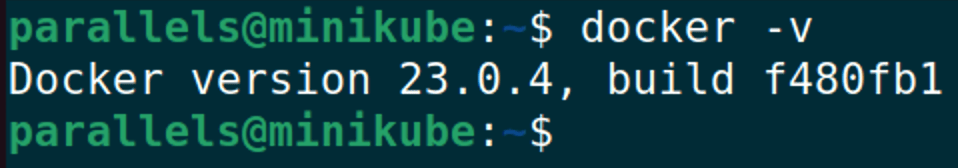
Minikube Install
Documentation for installing Minikube can be found at https://minikube.sigs.k8s.io/docs/start/
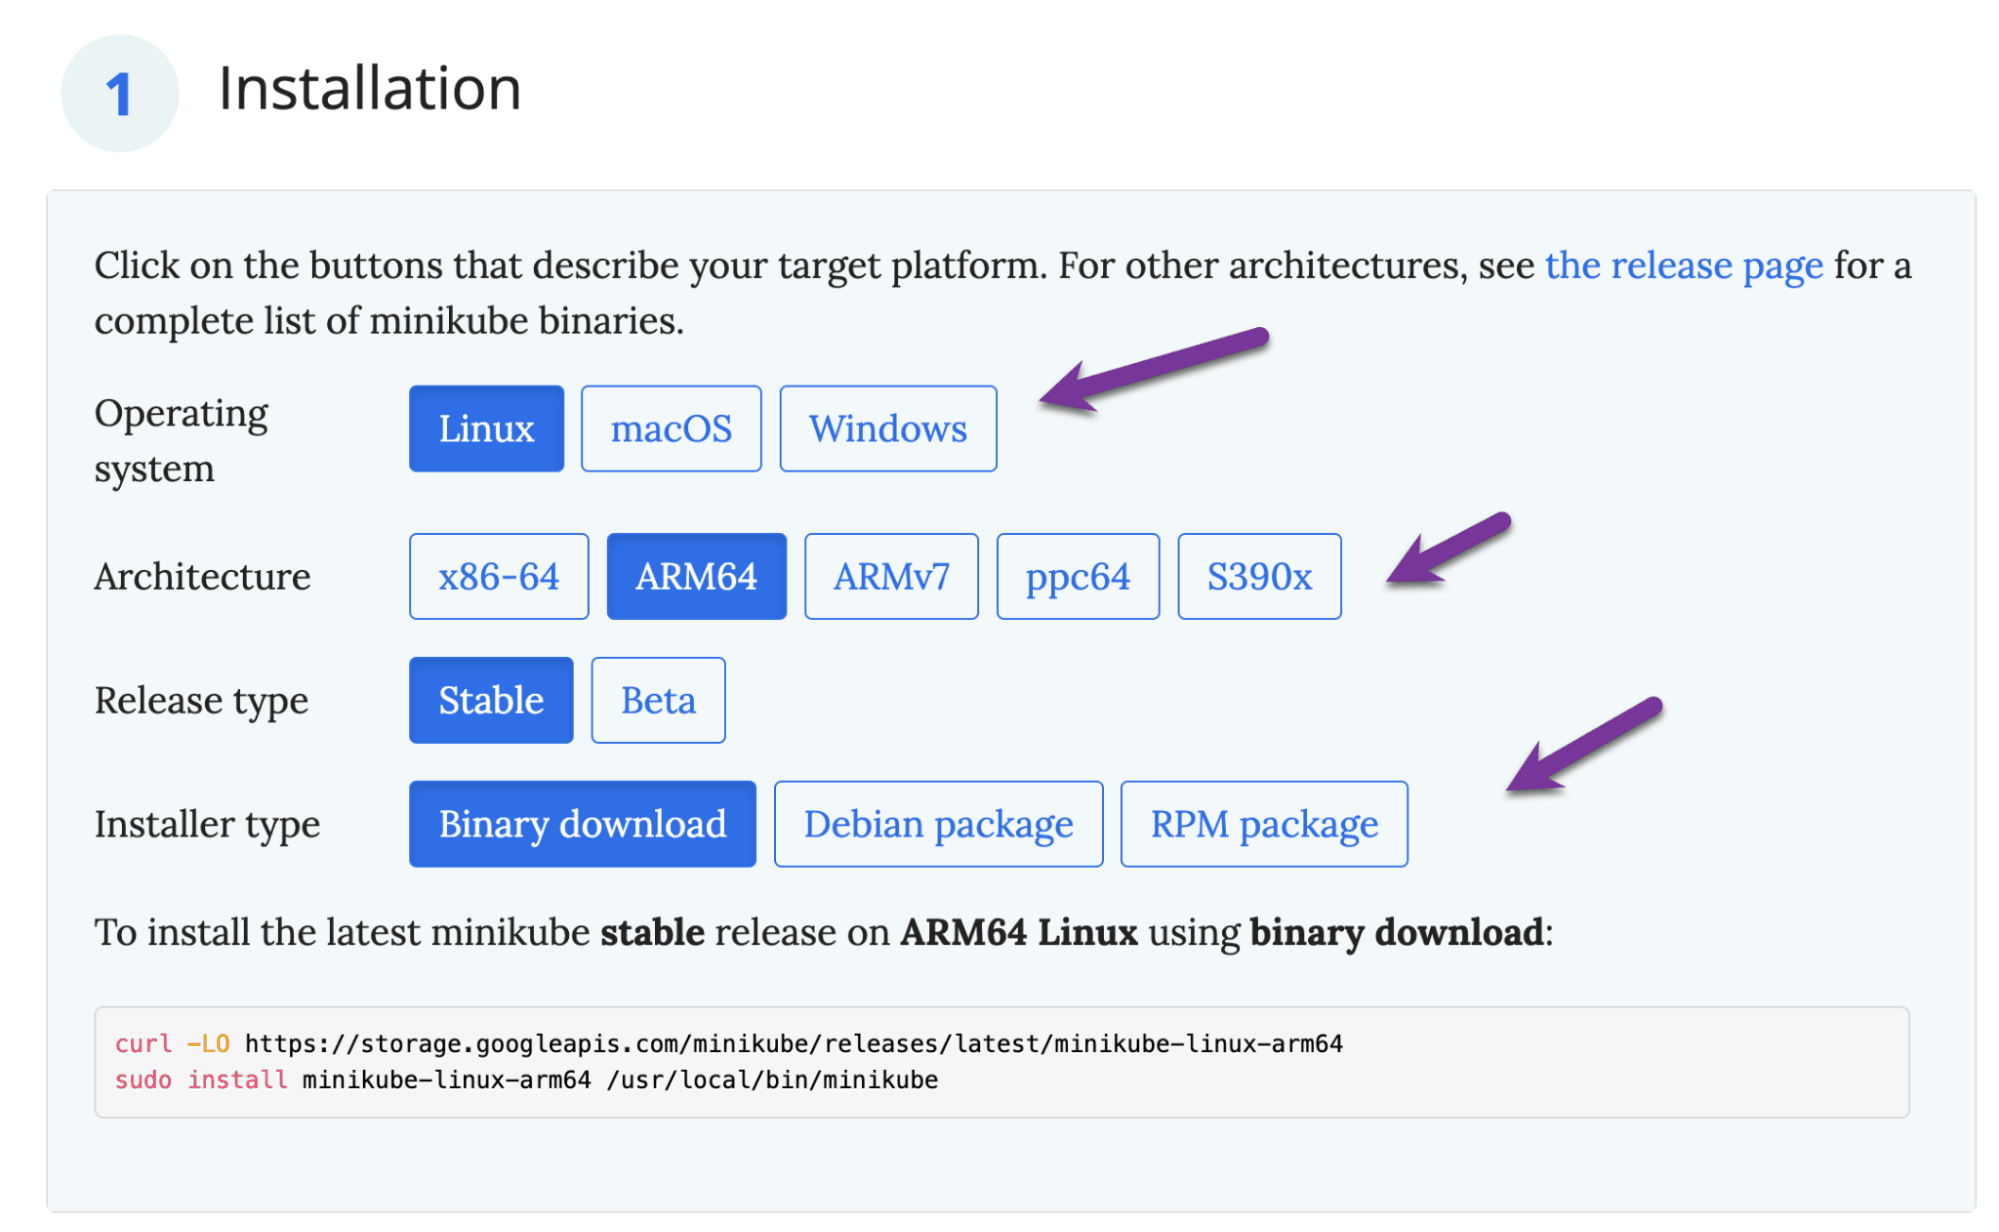
curl -LO https://storage.googleapis.com/minikube/releases/latest/minikube-linux-arm64
sudo install minikube-linux-arm64 /usr/local/bin/minikube

sudo usermod -aG docker $USER && newgrp docker
minikube start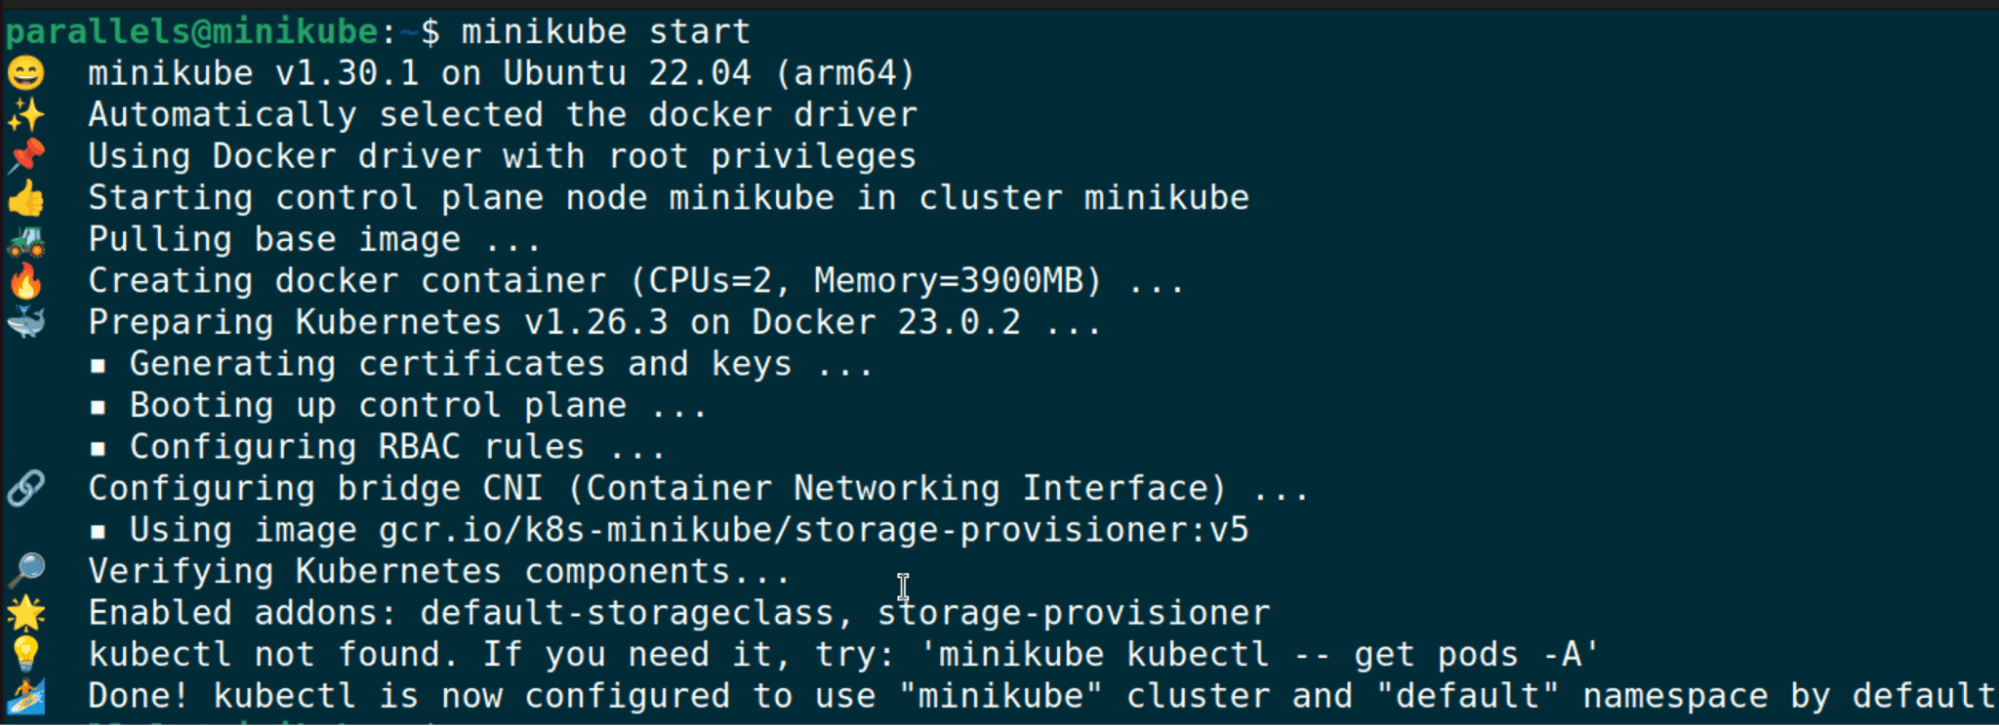
We can also run some quick kubectl commands to confirm that our cluster is set up properly:
minikube kubectl -- get po -A
alias kubectl="minikube kubectl --"
kubectl get nodes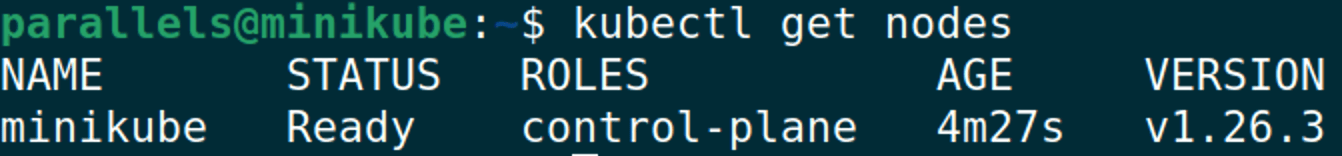
Auditd Setup
Documentation for auditd can be found at https://linux.die.net/man/8/auditd
To install auditd, run the following:
sudo apt-get install auditdAfter installing, we recommend modifying the audit rules to include the rules from Florian Roth’s configuration found here: https://github.com/Neo23x0/auditd/blob/master/audit.rules
cp /etc/audit/rules.d /etc/audit/rules.d.bak
# Replace audit.rules with Florian Roth's configuration

sudo service auditd restart
tail -f /var/log/audit/audit.log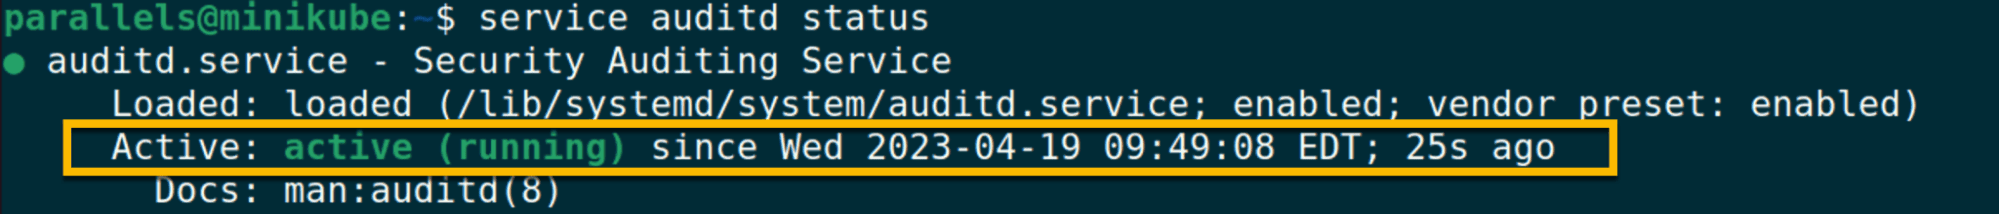
Laurel Setup
Documentation for Laurel can be found at https://github.com/threathunters-io/laurel
One of the downsides of auditd logging is the format of the logs. Auditd logs can be difficult to ingest and parse, and it’s useful to convert them into a JSON format prior to ingestion into a SIEM. Thankfully, the team at Threathunters has developed Laurel, which will convert auditd logs into JSON format.
wget https://github.com/threathunters-io/laurel/releases/download/v0.5.1/laurel-v0.5.1-aarch64-musl.tar.gz
tar xzf laurel-v0.5.1-aarch64-musl.tar.gz
sudo install -m755 laurel /usr/local/sbin/laurel

sudo useradd --system --home-dir /var/log/laurel --create-home _laurel

sudo mkdir /etc/laurel
sudo wget https://raw.githubusercontent.com/threathunters-io/laurel/v0.5.1/etc/laurel/config.toml -O /etc/laurel/config.toml

sudo wget https://raw.githubusercontent.com/threathunters-io/laurel/v0.5.1/etc/audit/plugins.d/laurel.conf -O /etc/audit/plugins.d/laurel.conf

sudo pkill -HUP auditd
sudo apt install jq
cat /var/log/laurel/audit.log | jq
Vectr Setup
Documentation for Vectr can be found at https://github.com/SecurityRiskAdvisors/VECTR
Note: At time of writing, only x64 platforms are supported for Vectr installations. If you are running an ARM-based machine (such as Apple silicon), you will need to spin up a separate x64 VM for Vectr or use a cloud-based installation.
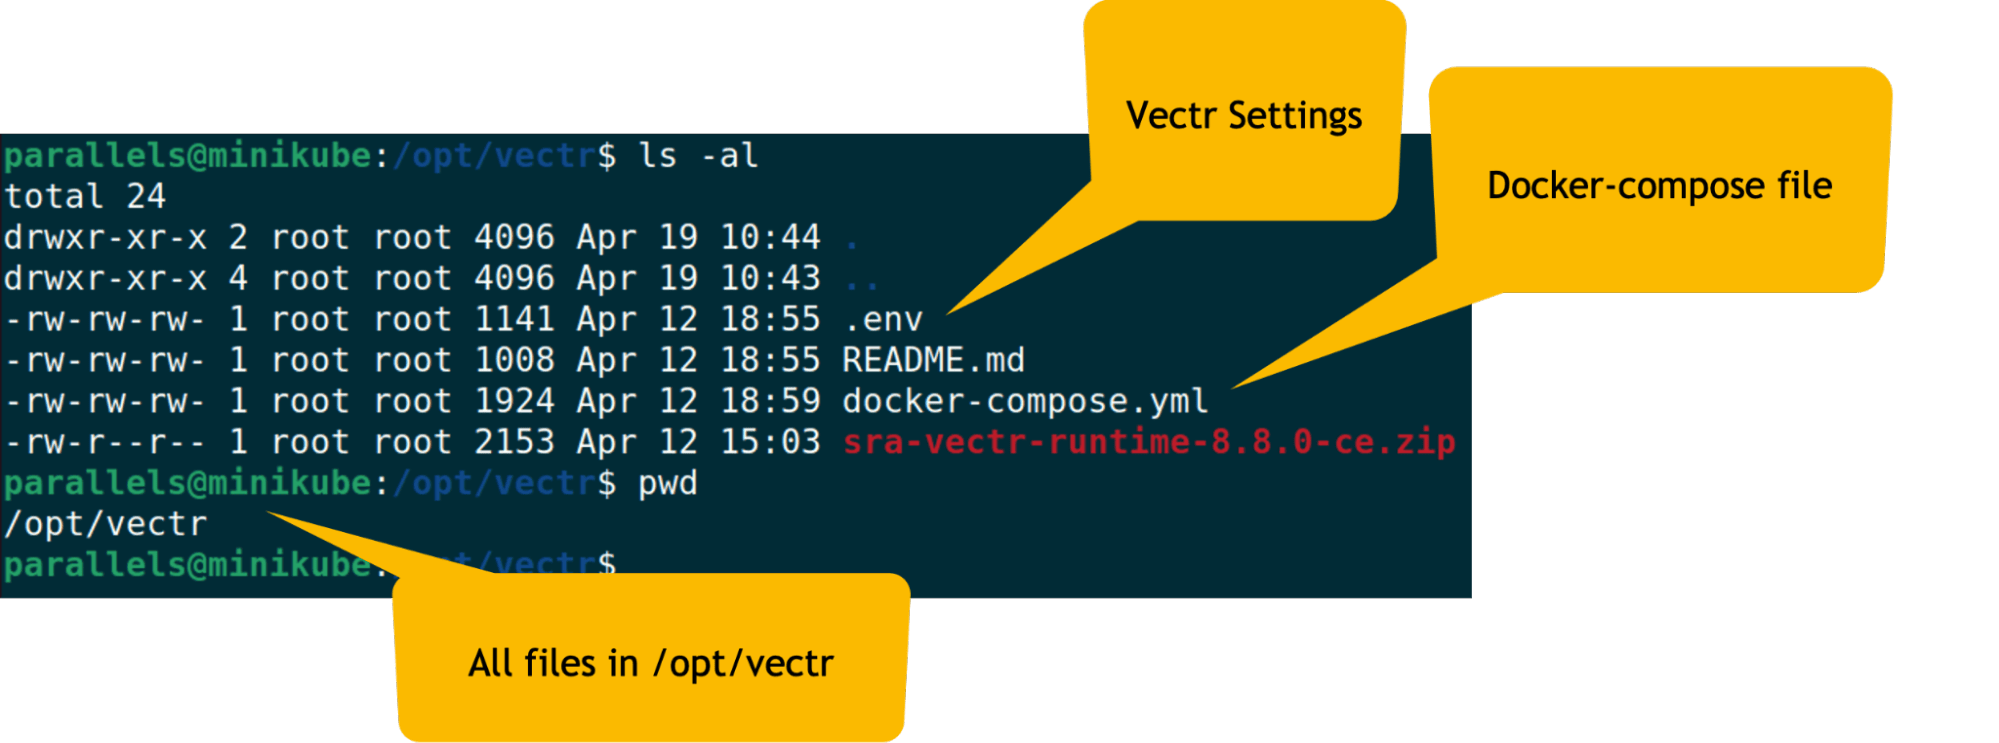
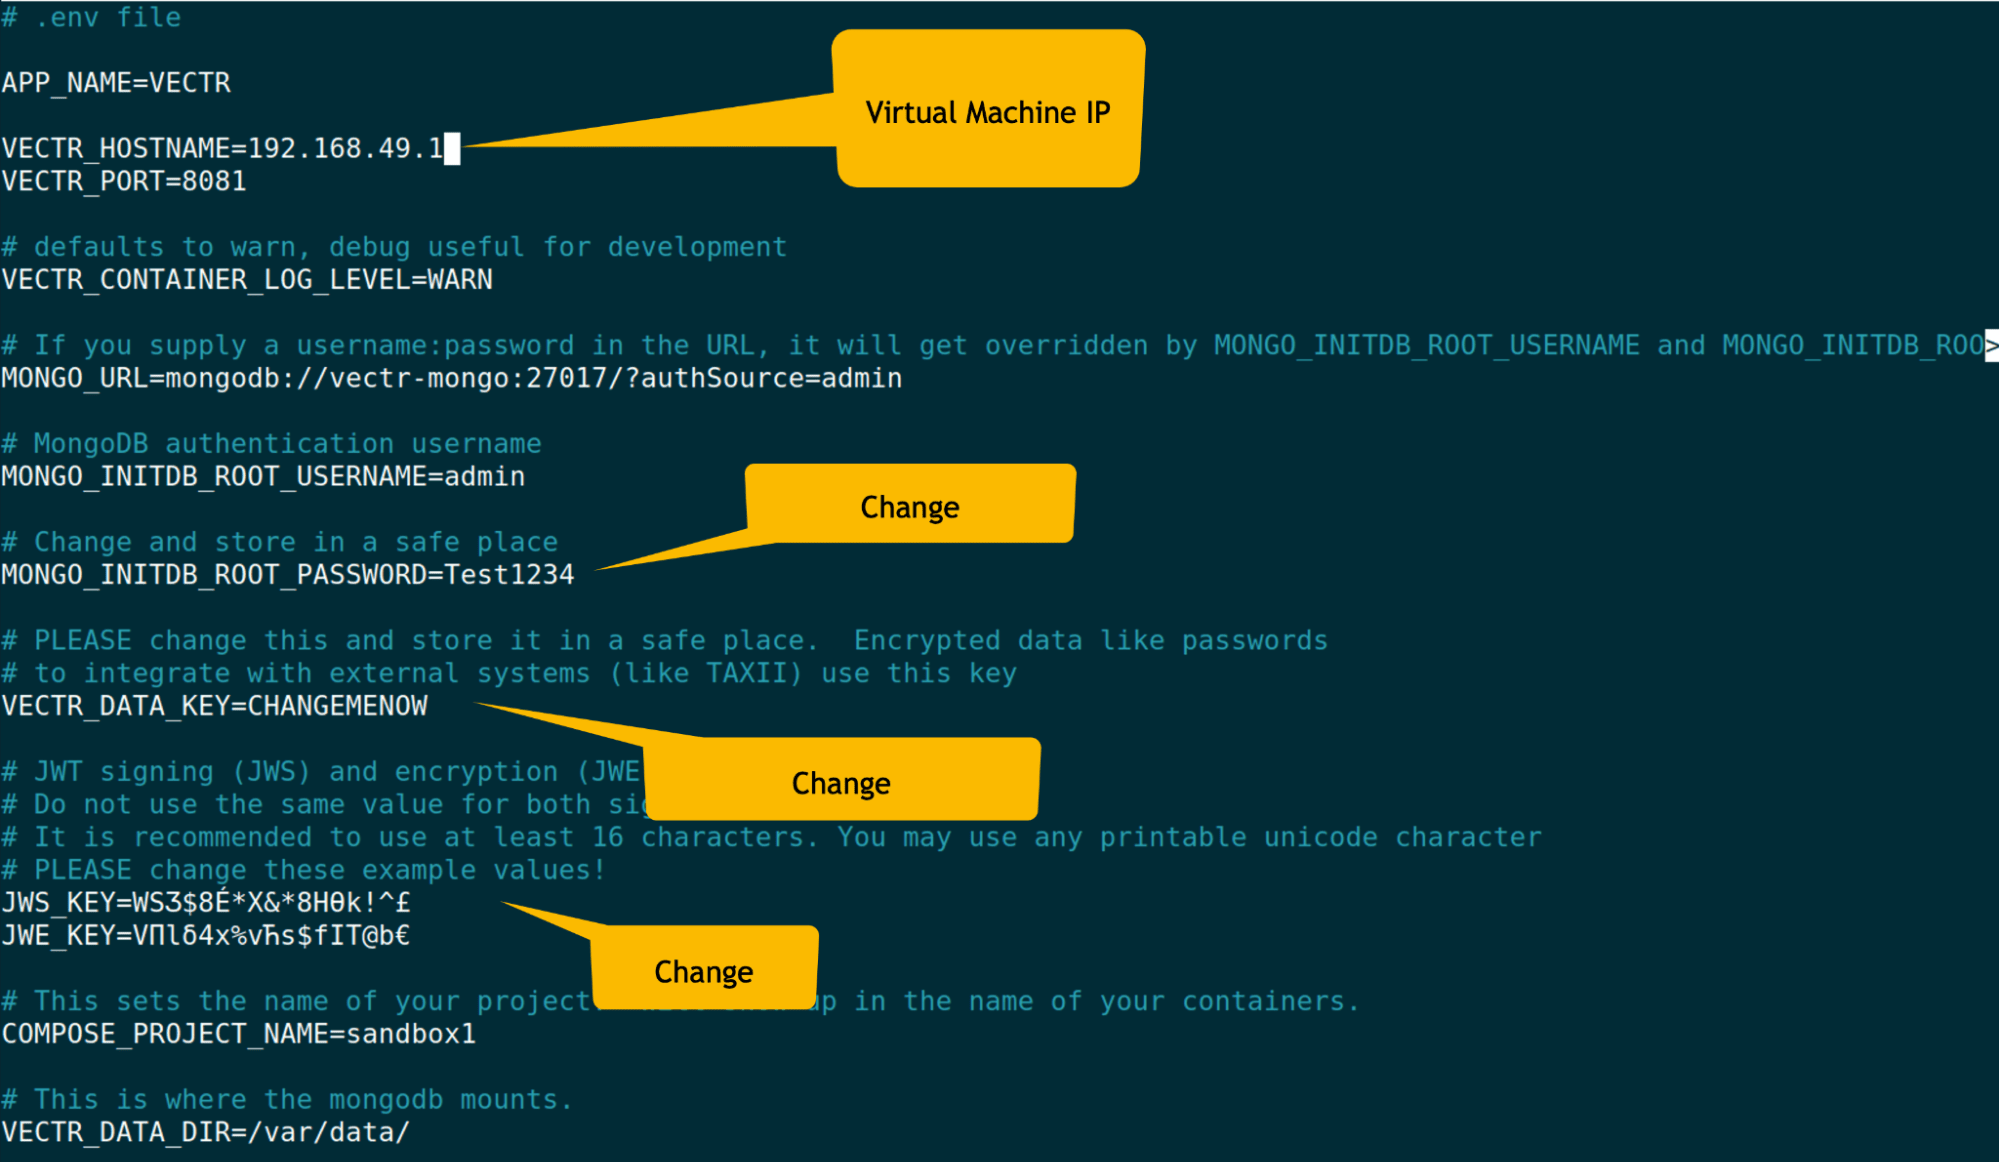
After cloning the Vectr repository, navigate to the runtime directory and edit the .env file. You will need to update the VECTR_HOSTNAME variable to match the IP address of your VM.
Once the .env file is configured, you can start Vectr with Docker Compose:
sudo docker-compose up -d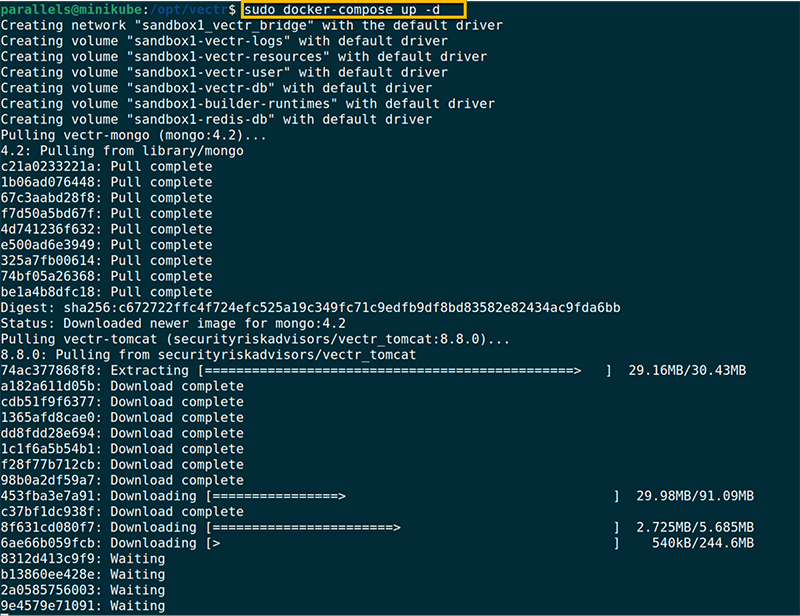
After the containers have started, you can access Vectr via https://virtualmachineIPAddress:8081
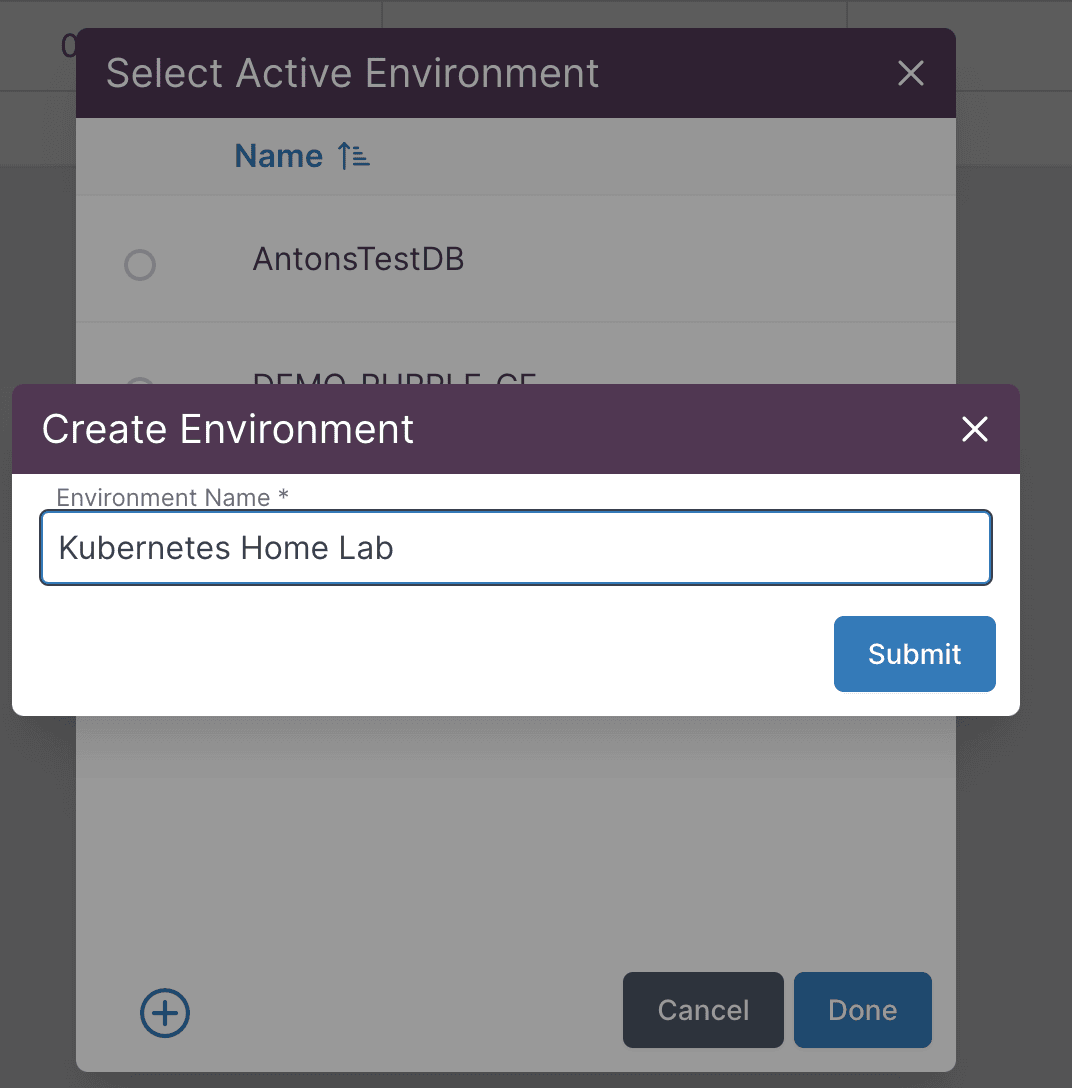
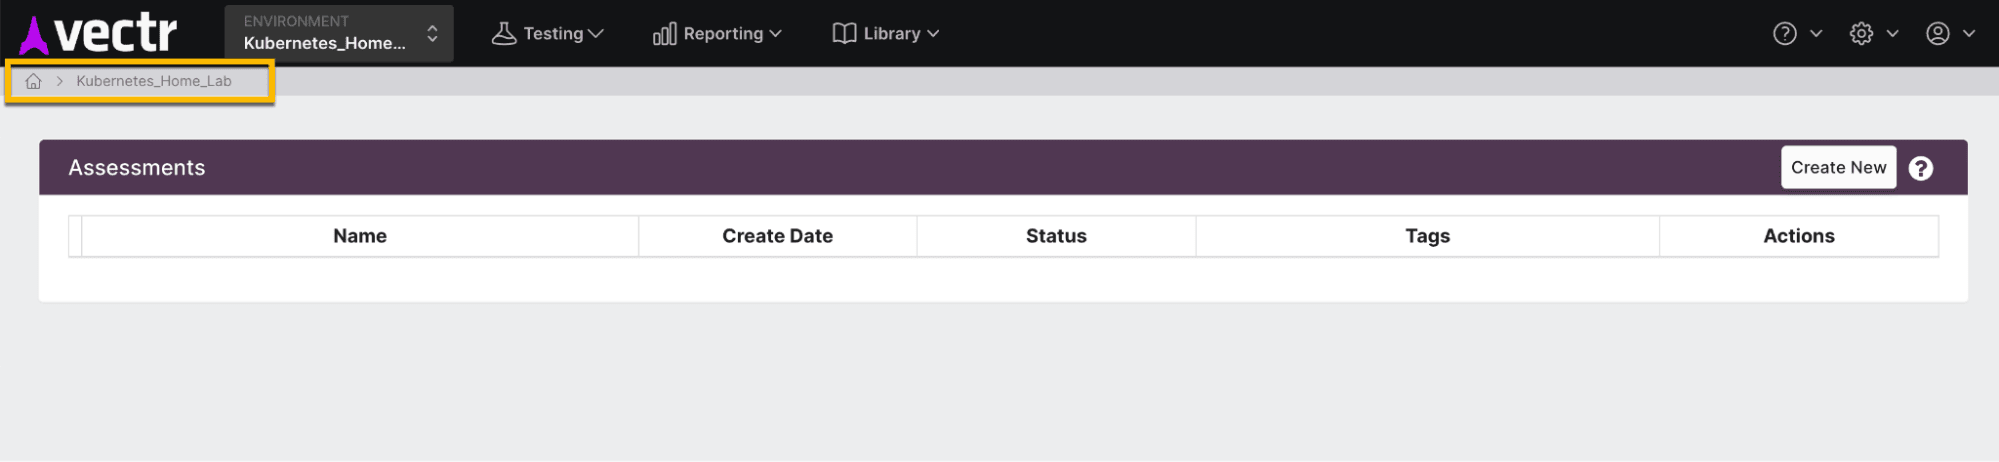
Create a new environment in Vectr to track your purple teaming exercises:
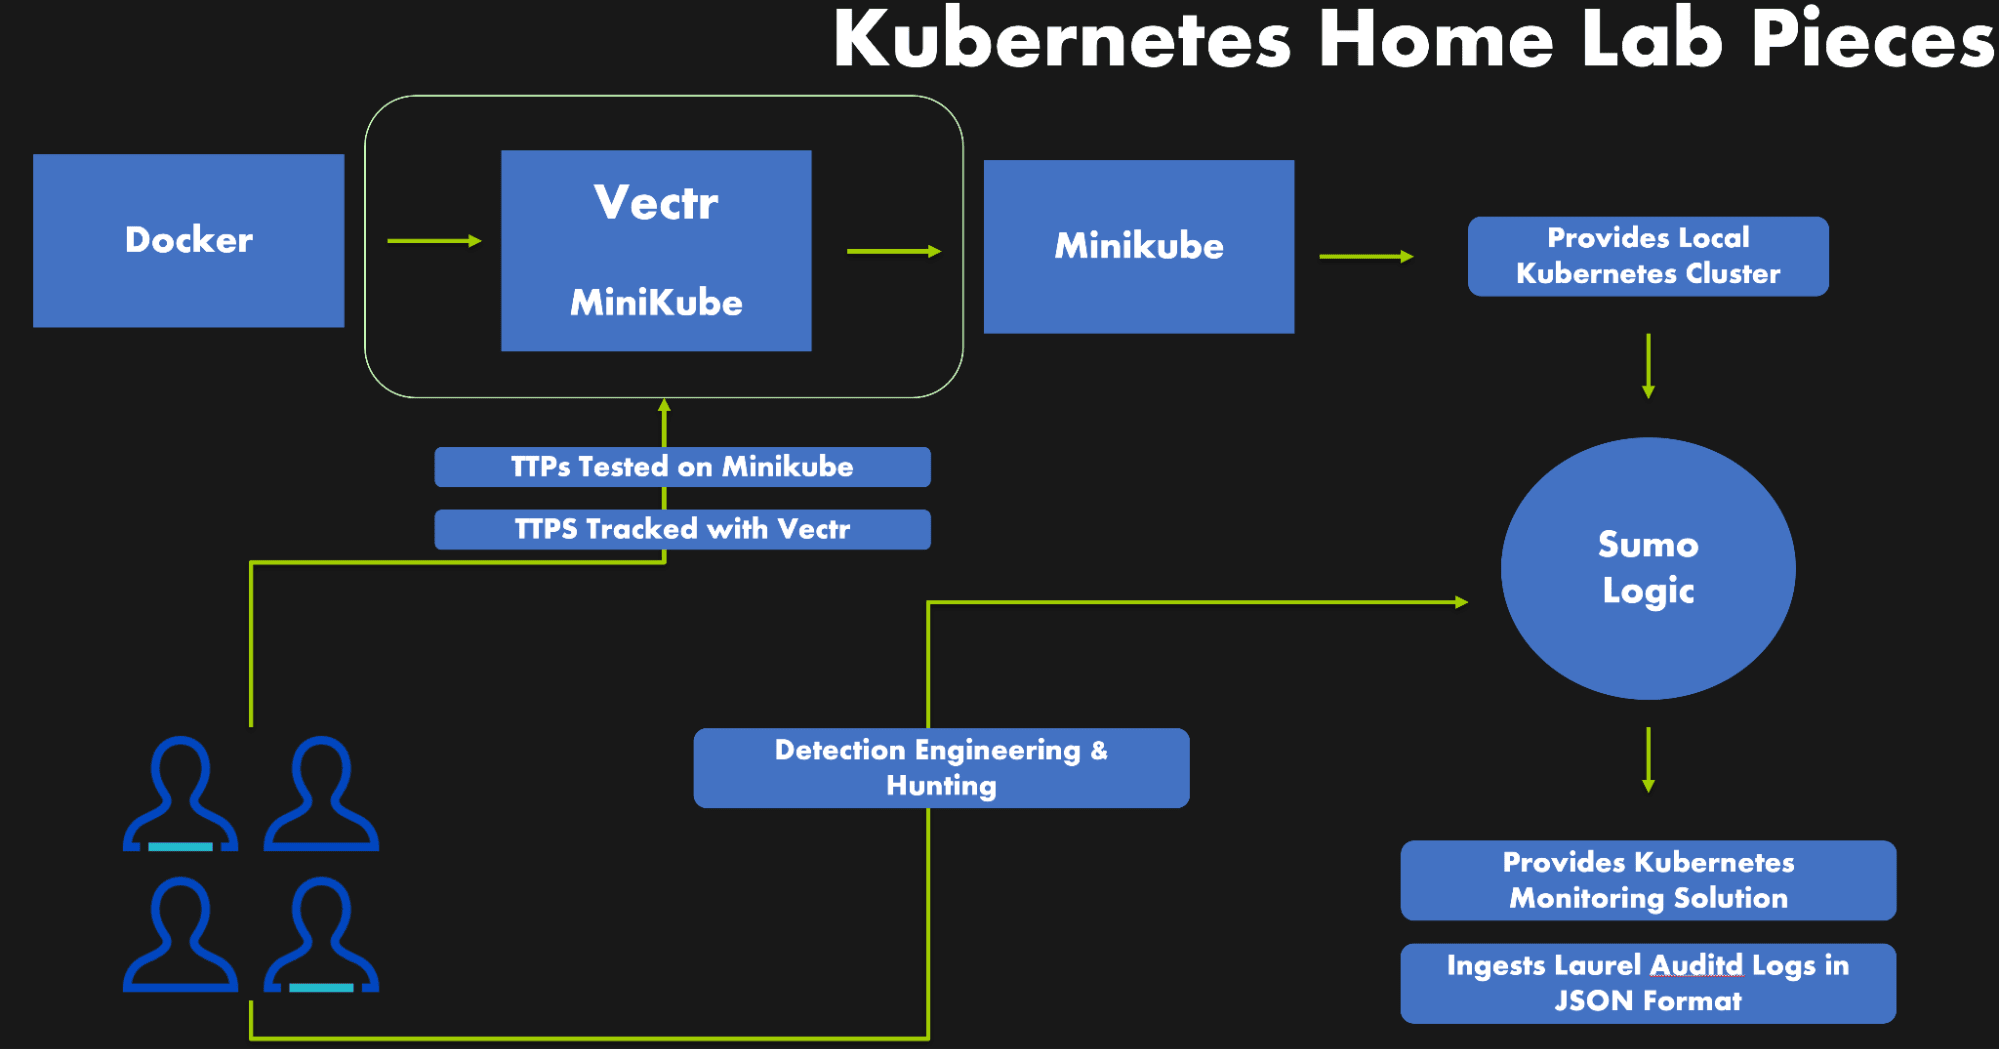
System Architecture
With all of our tools installed and configured, our system architecture looks like the following:
Sumo Logic Setup
In order to gain visibility into our Kubernetes cluster, we will be using Sumo Logic. Sumo Logic provides a Helm chart that can be deployed to Kubernetes clusters to collect logs, metrics, and events.
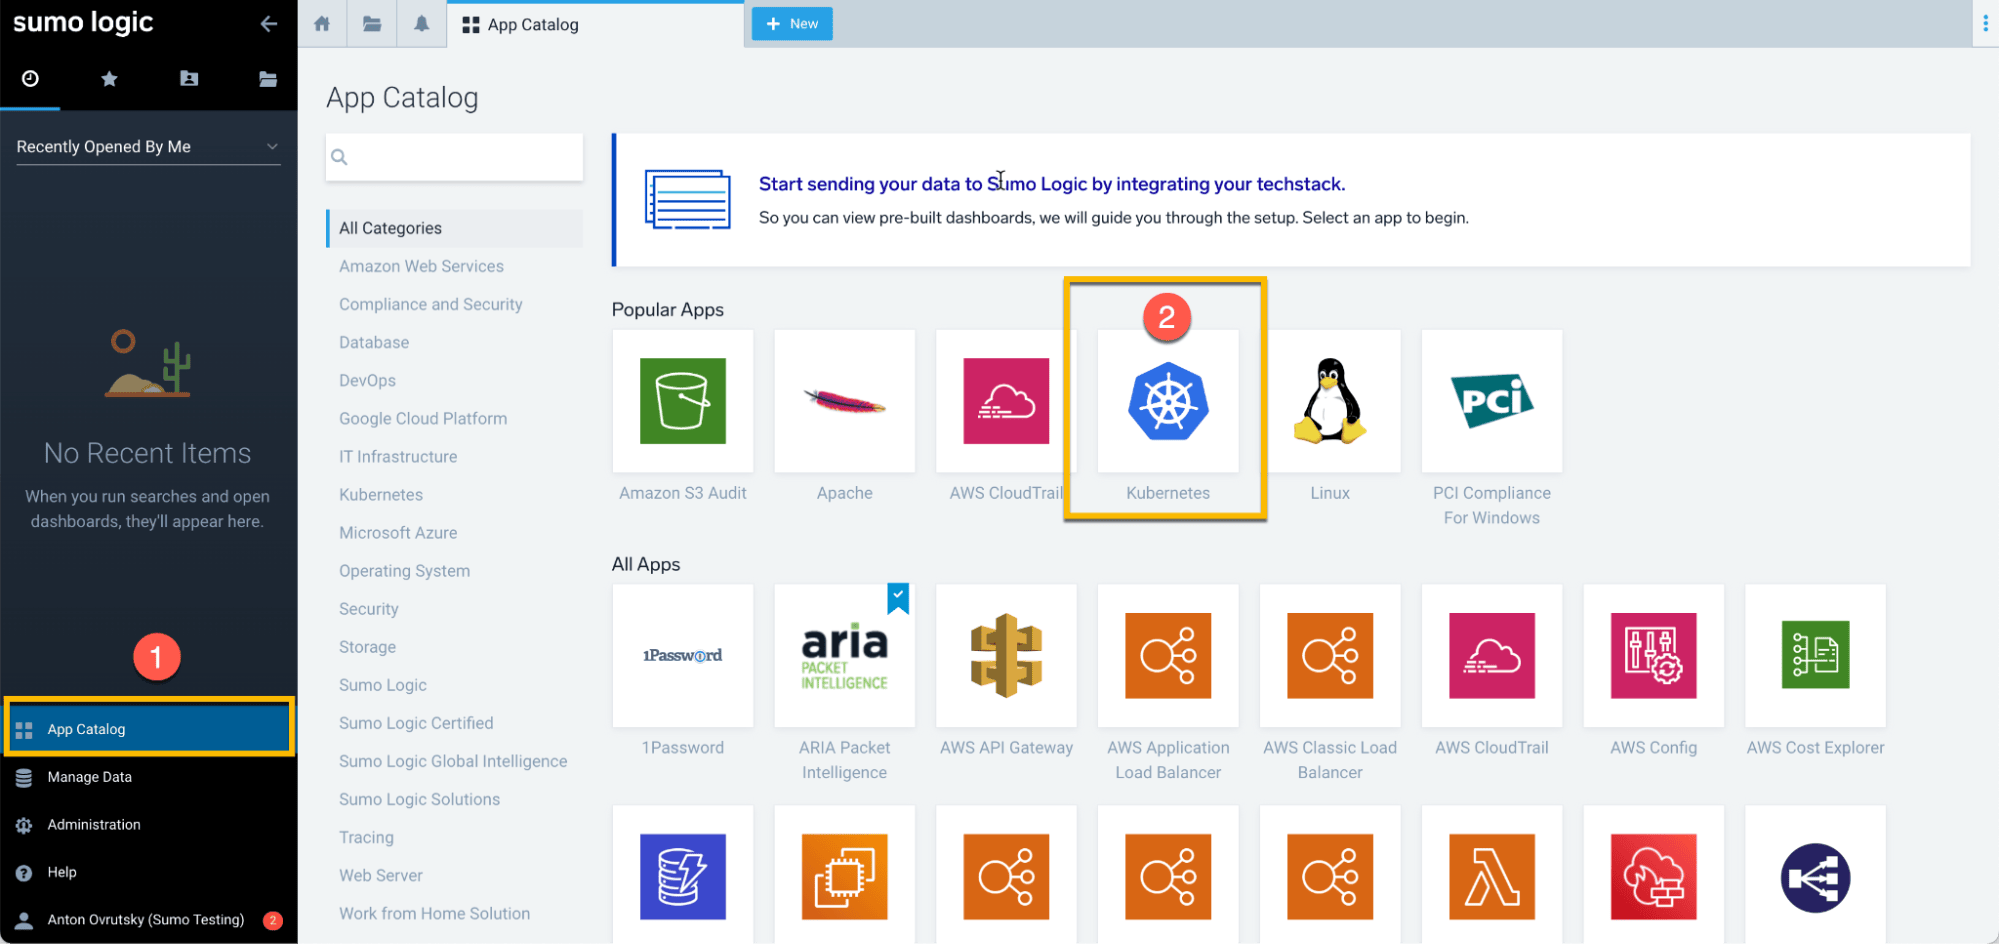
Kubernetes Monitoring
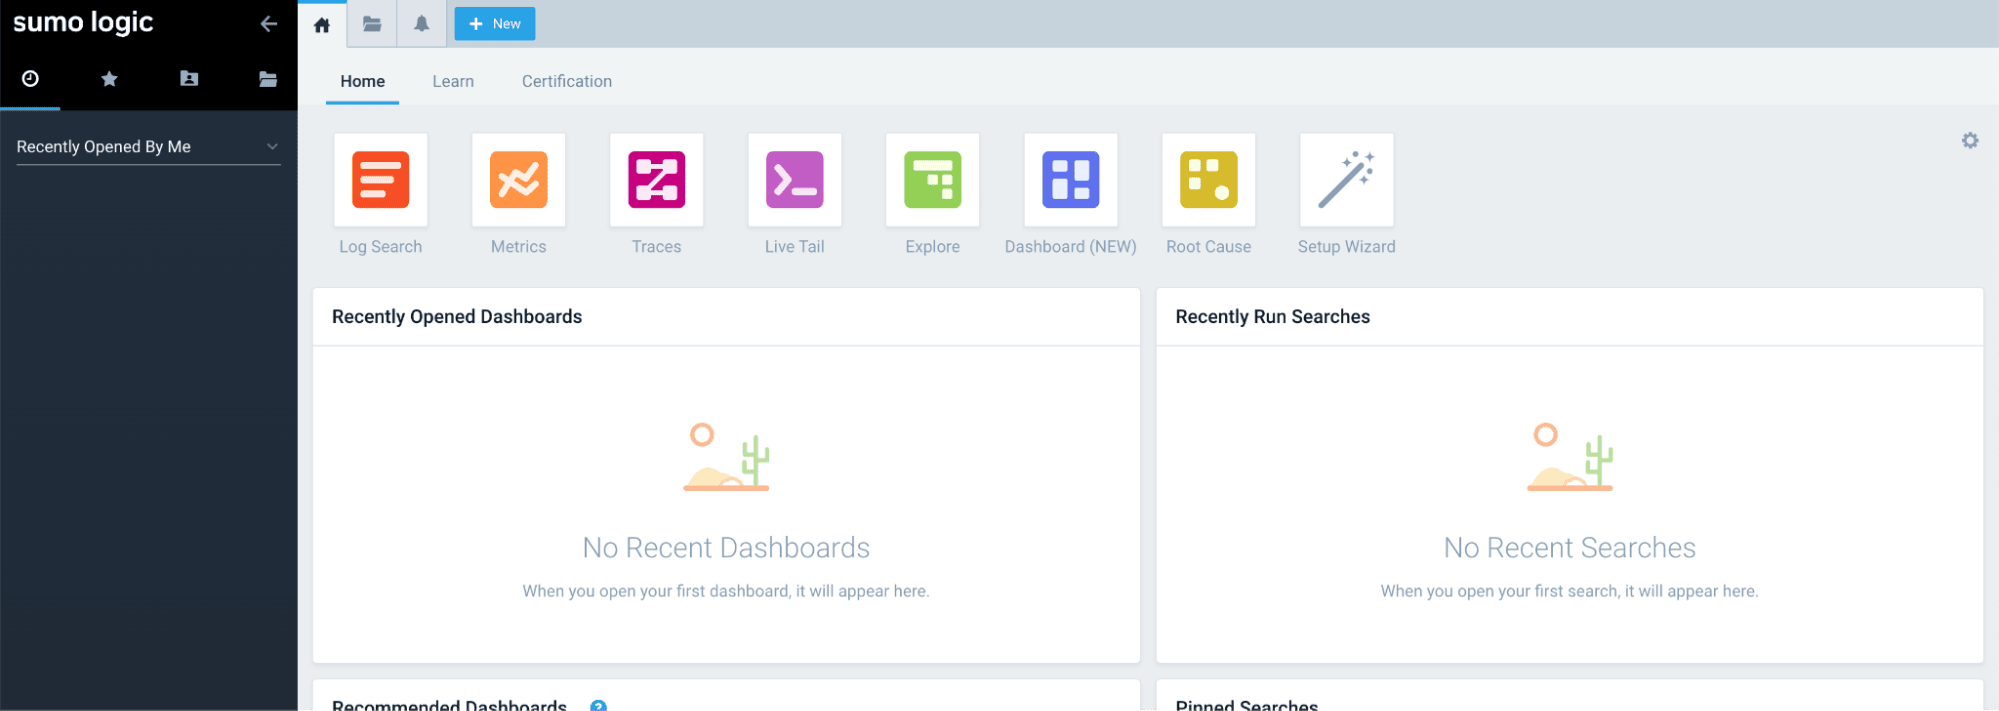
Navigate to the App Catalog and search for Kubernetes:
Follow the instructions to install the Helm chart. You will need to install Helm first if you haven’t already:
curl -fsSL -o get_helm.sh https://raw.githubusercontent.com/helm/helm/main/scripts/get-helm-3
chmod 700 get_helm.sh
./get_helm.sh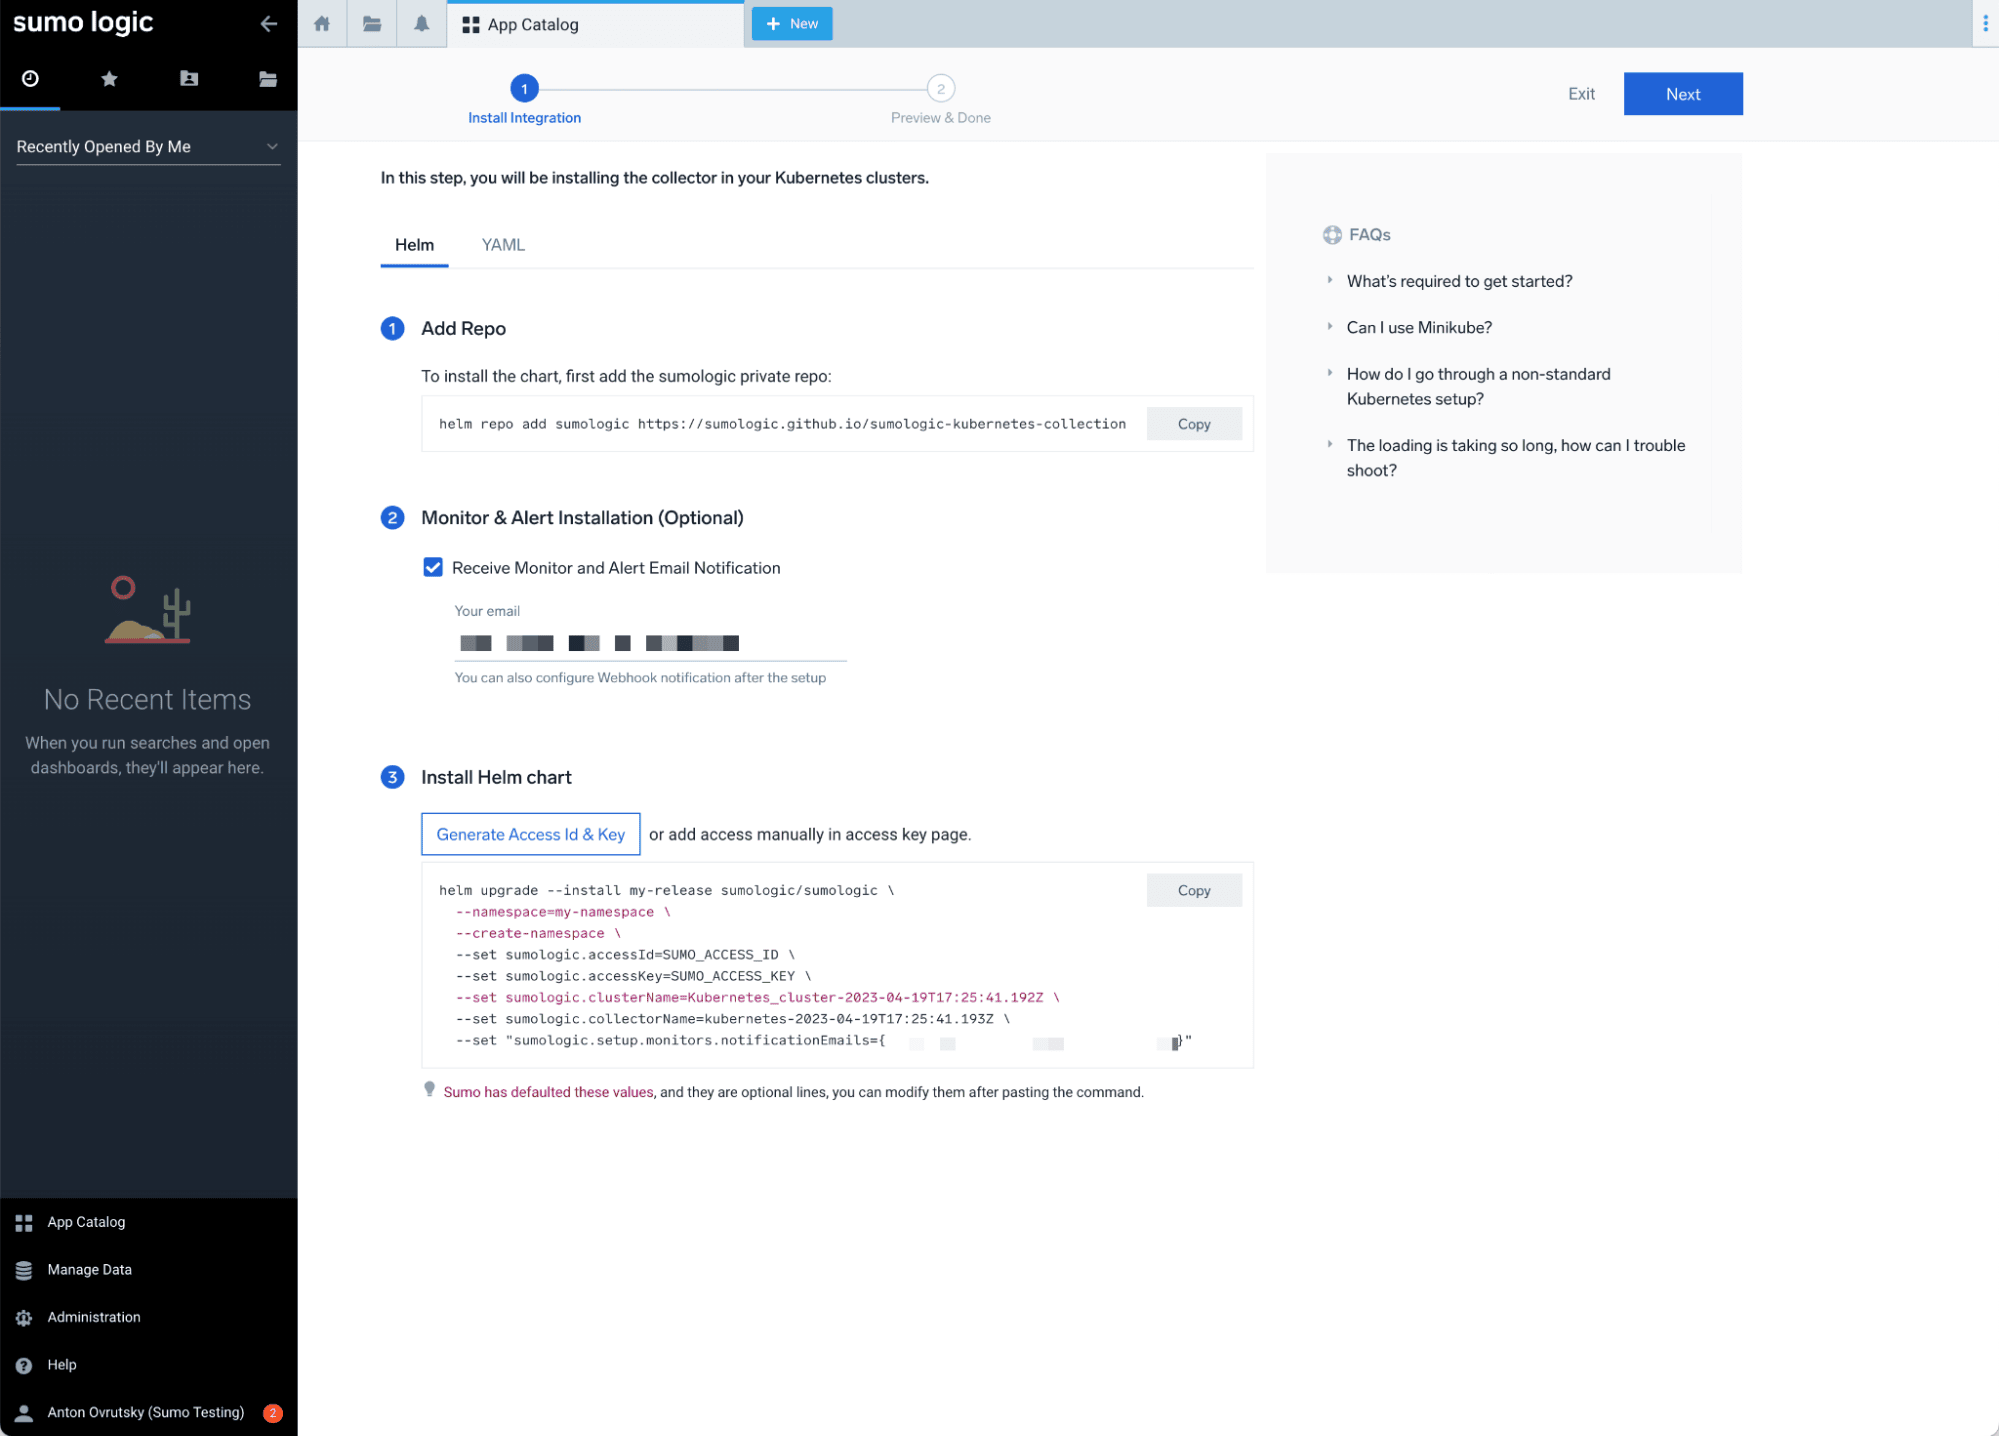
Deploy the Helm chart with your Sumo Logic access credentials:
helm upgrade --install my-release sumologic/sumologic \
  --namespace=default \
  --create-namespace \
  --set sumologic.accessId=YOUR_ACCESS_ID \
  --set sumologic.accessKey=YOUR_ACCESS_KEY \
  --set sumologic.clusterName=minikube \
  --set sumologic.collectorName=minikube-collector \
  --set sumologic.setup.monitors.enabled=true \
  -f /path/to/user_values.yaml
You may need to allocate additional resources to your Minikube cluster for the Helm chart to deploy successfully:
minikube stop
minikube config set memory 4192
minikube config set cpus 4
minikube start --nodes 2
To test our Kubernetes monitoring, let’s deploy a simple Ubuntu pod:
apiVersion: v1
kind: Pod
metadata:
  name: ubuntu
  labels:
    app: ubuntu
spec:
  containers:
  - image: ubuntu
    command:
      - "sleep"
      - "604800"
    imagePullPolicy: IfNotPresent
    name: ubuntu
  restartPolicy: Always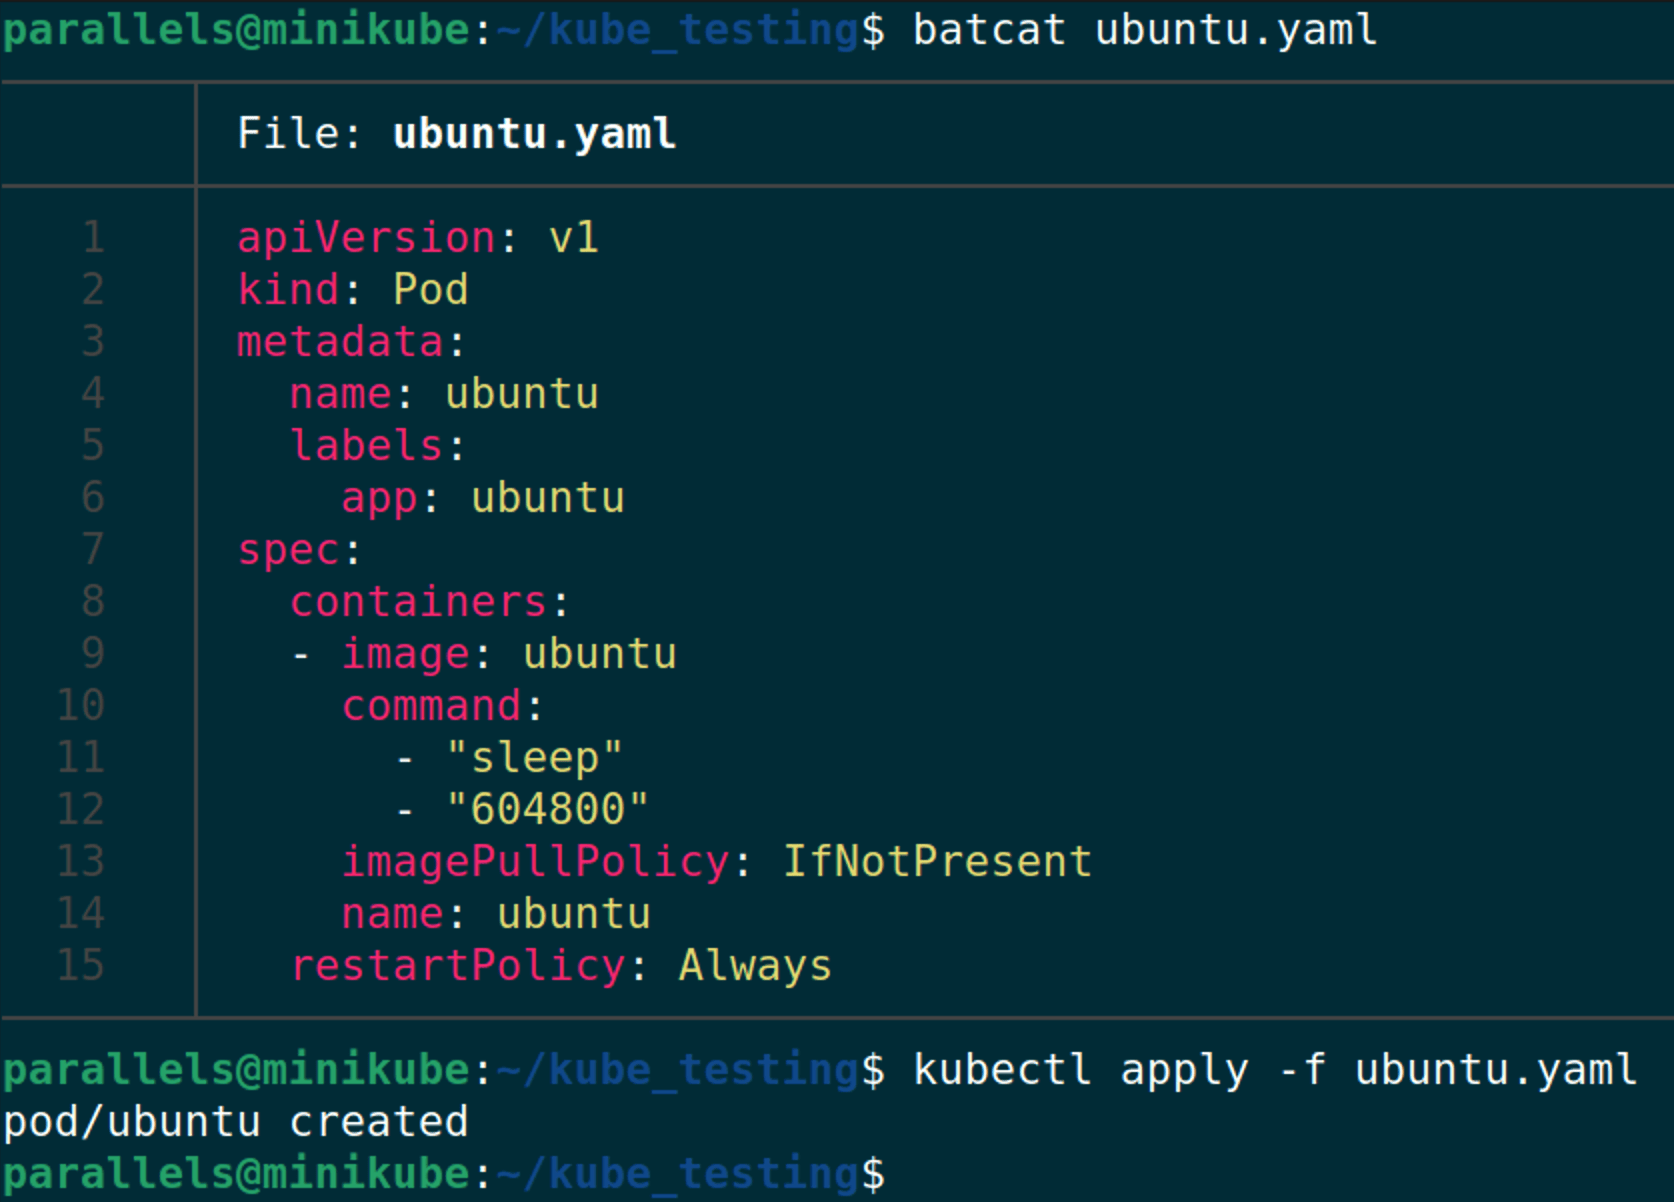
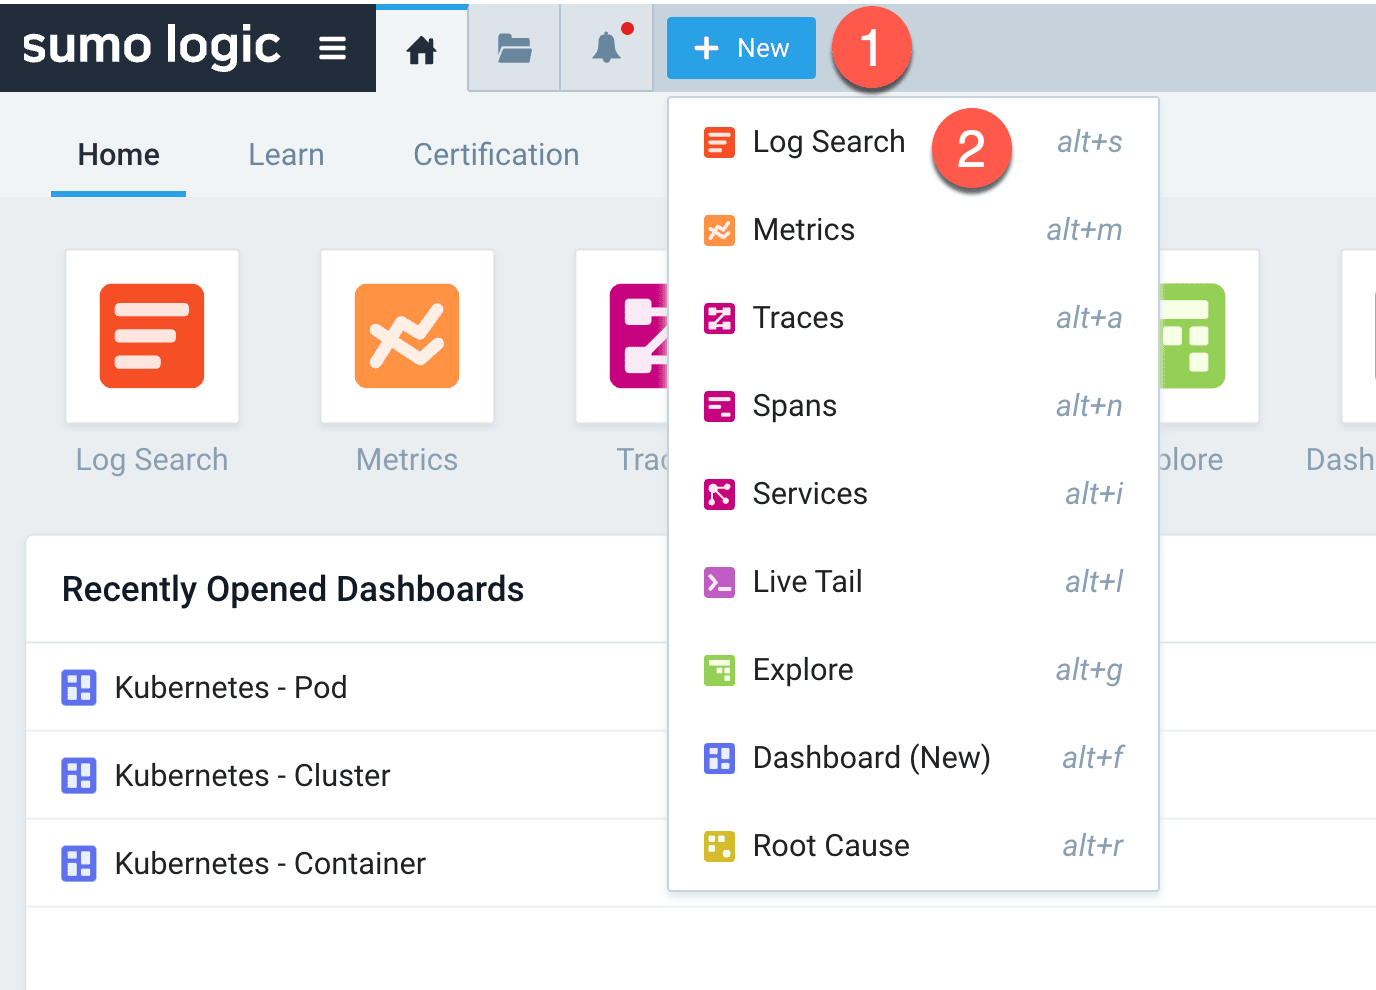
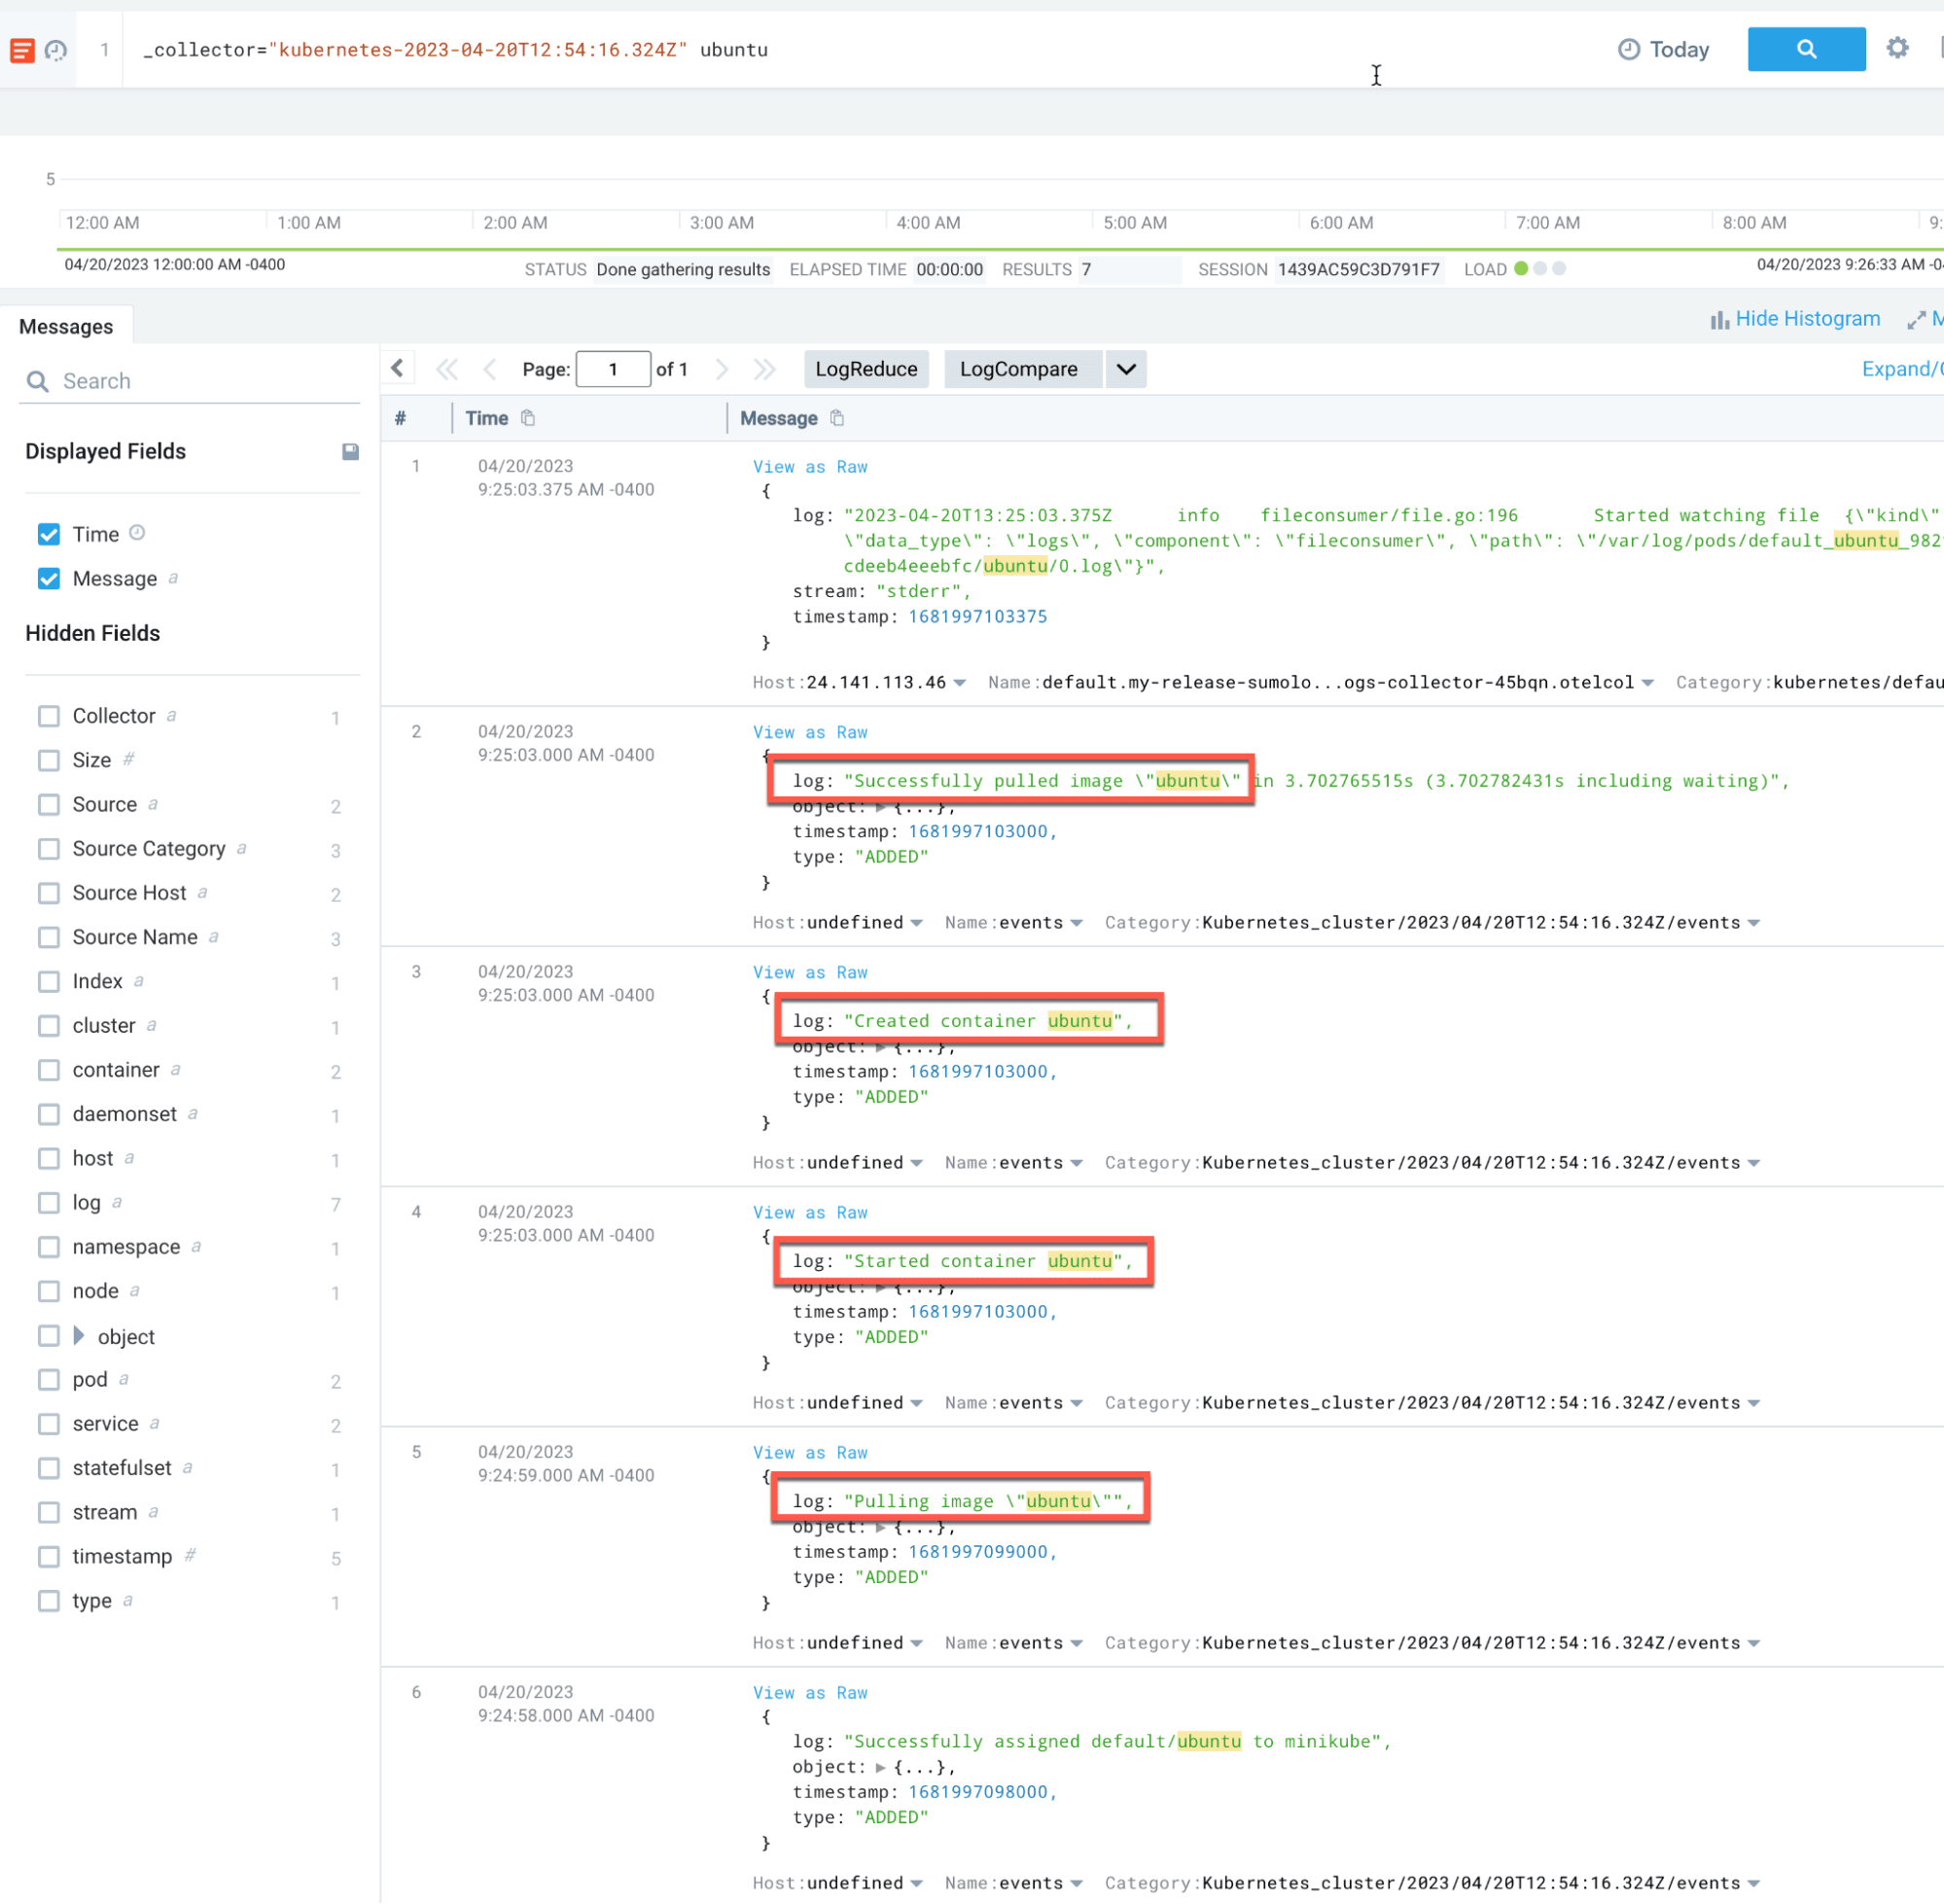
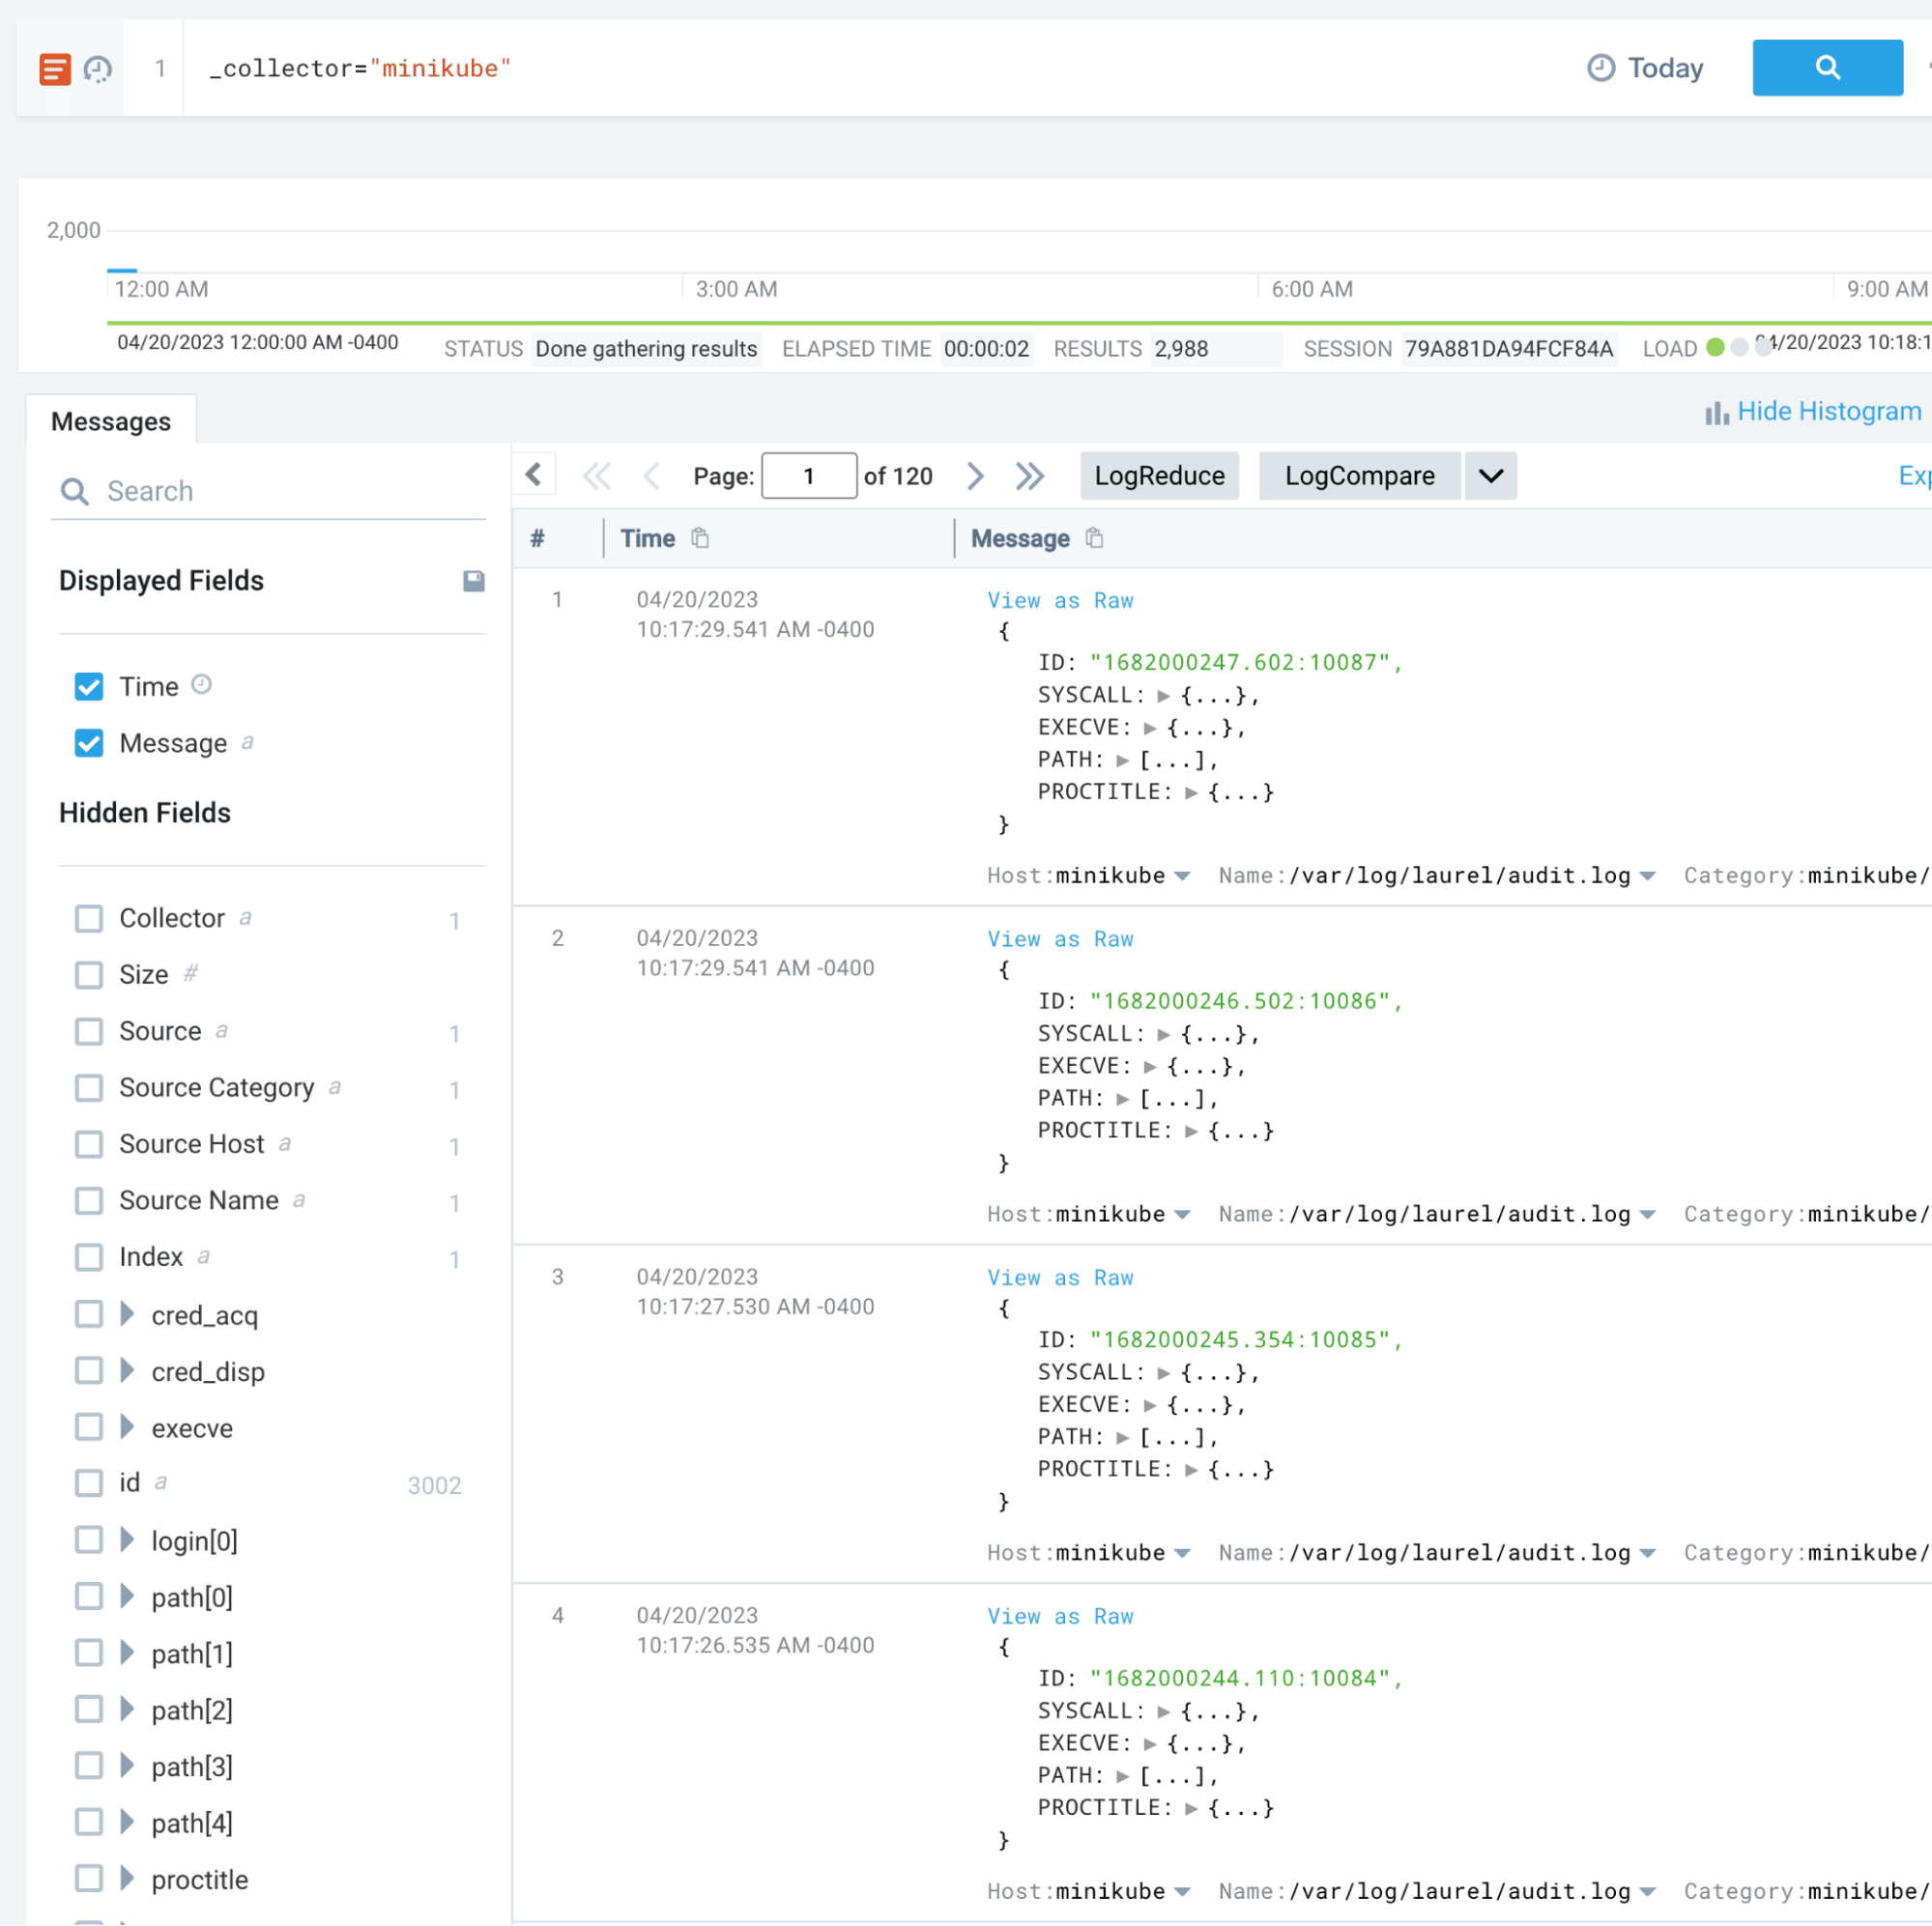
We can create a new log search in Sumo Logic to verify that our Kubernetes telemetry is being collected:
Host Monitoring
In addition to Kubernetes-level monitoring, we also want to collect host-level telemetry from the VM where our cluster is running. This will allow us to see the commands being run on the host, including kubectl commands.
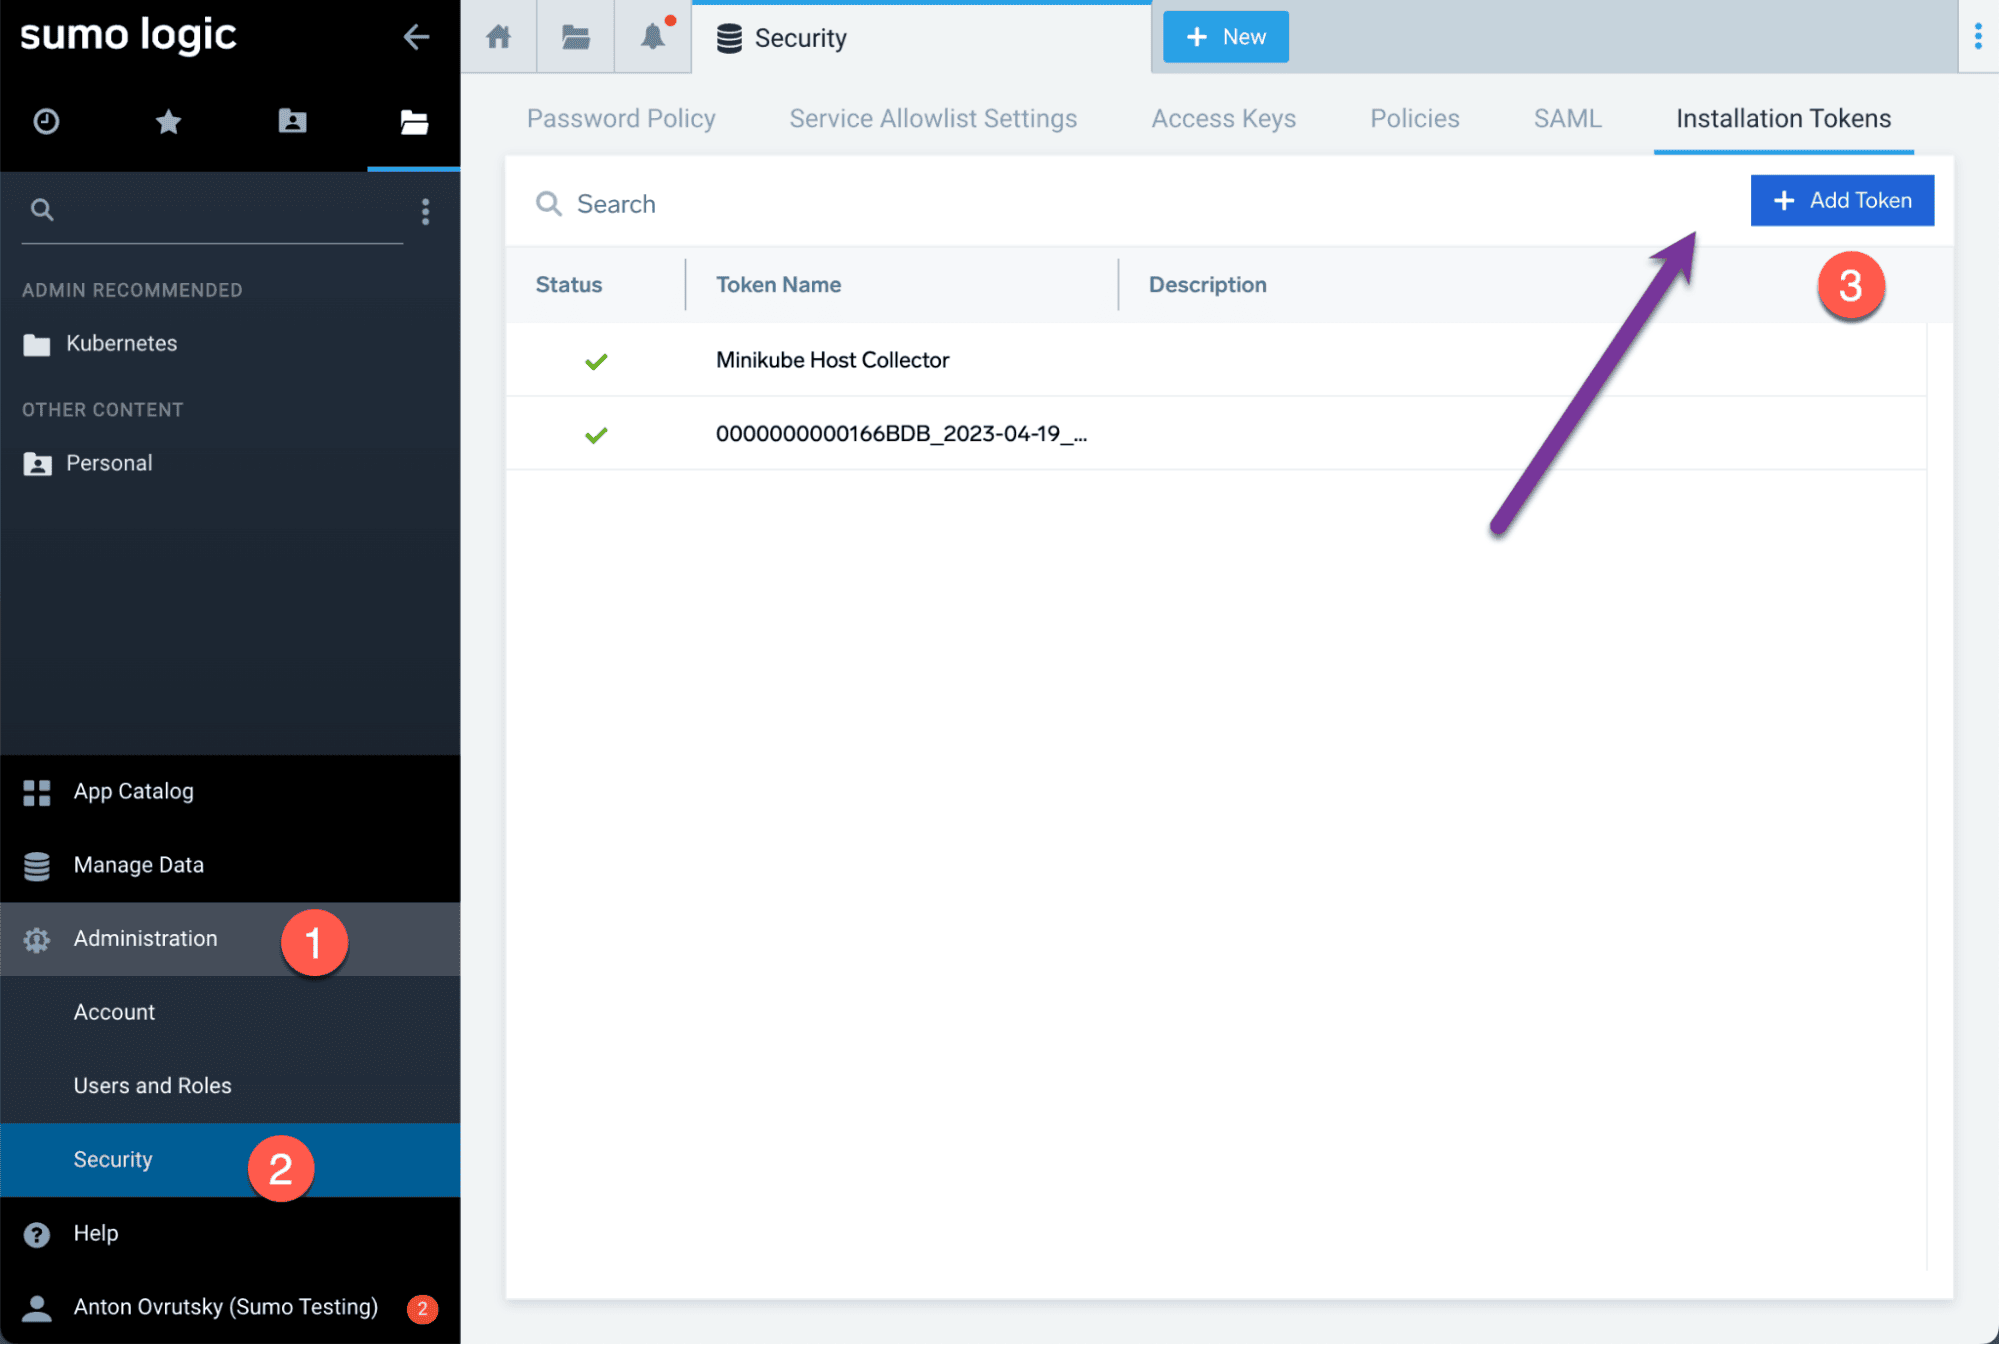
Generate a token for the collector:
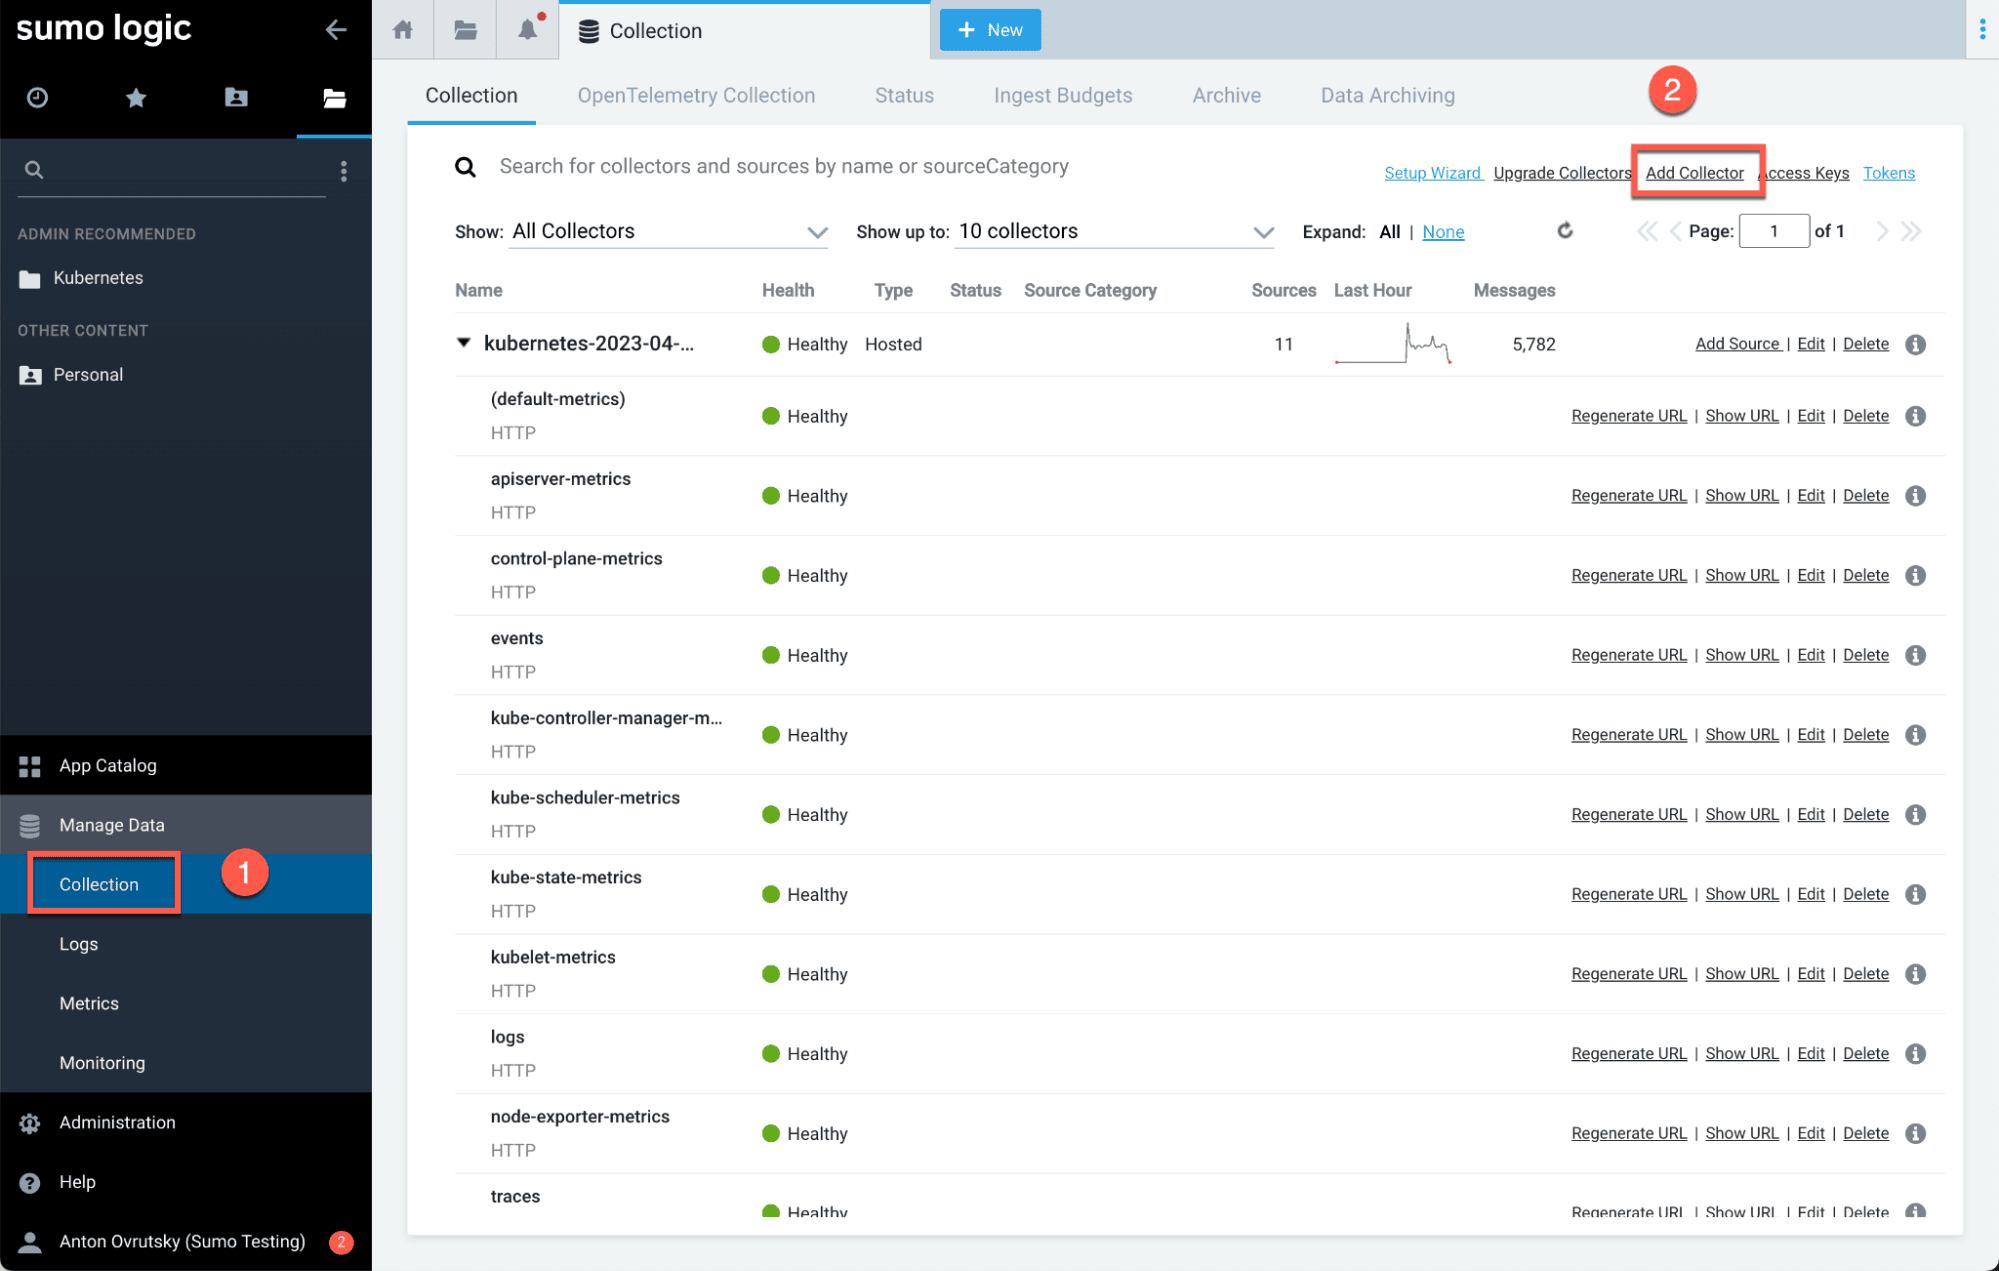
Download and install the collector:
wget https://collectors.ca.sumologic.com/rest/download/linux/aarch/64 -O SumoCollector_linux_arm64_19_418-7.sh

SumoCollector_linux_arm64_19_418-7.sh -q -Vsumo.token_and_url=<your_token>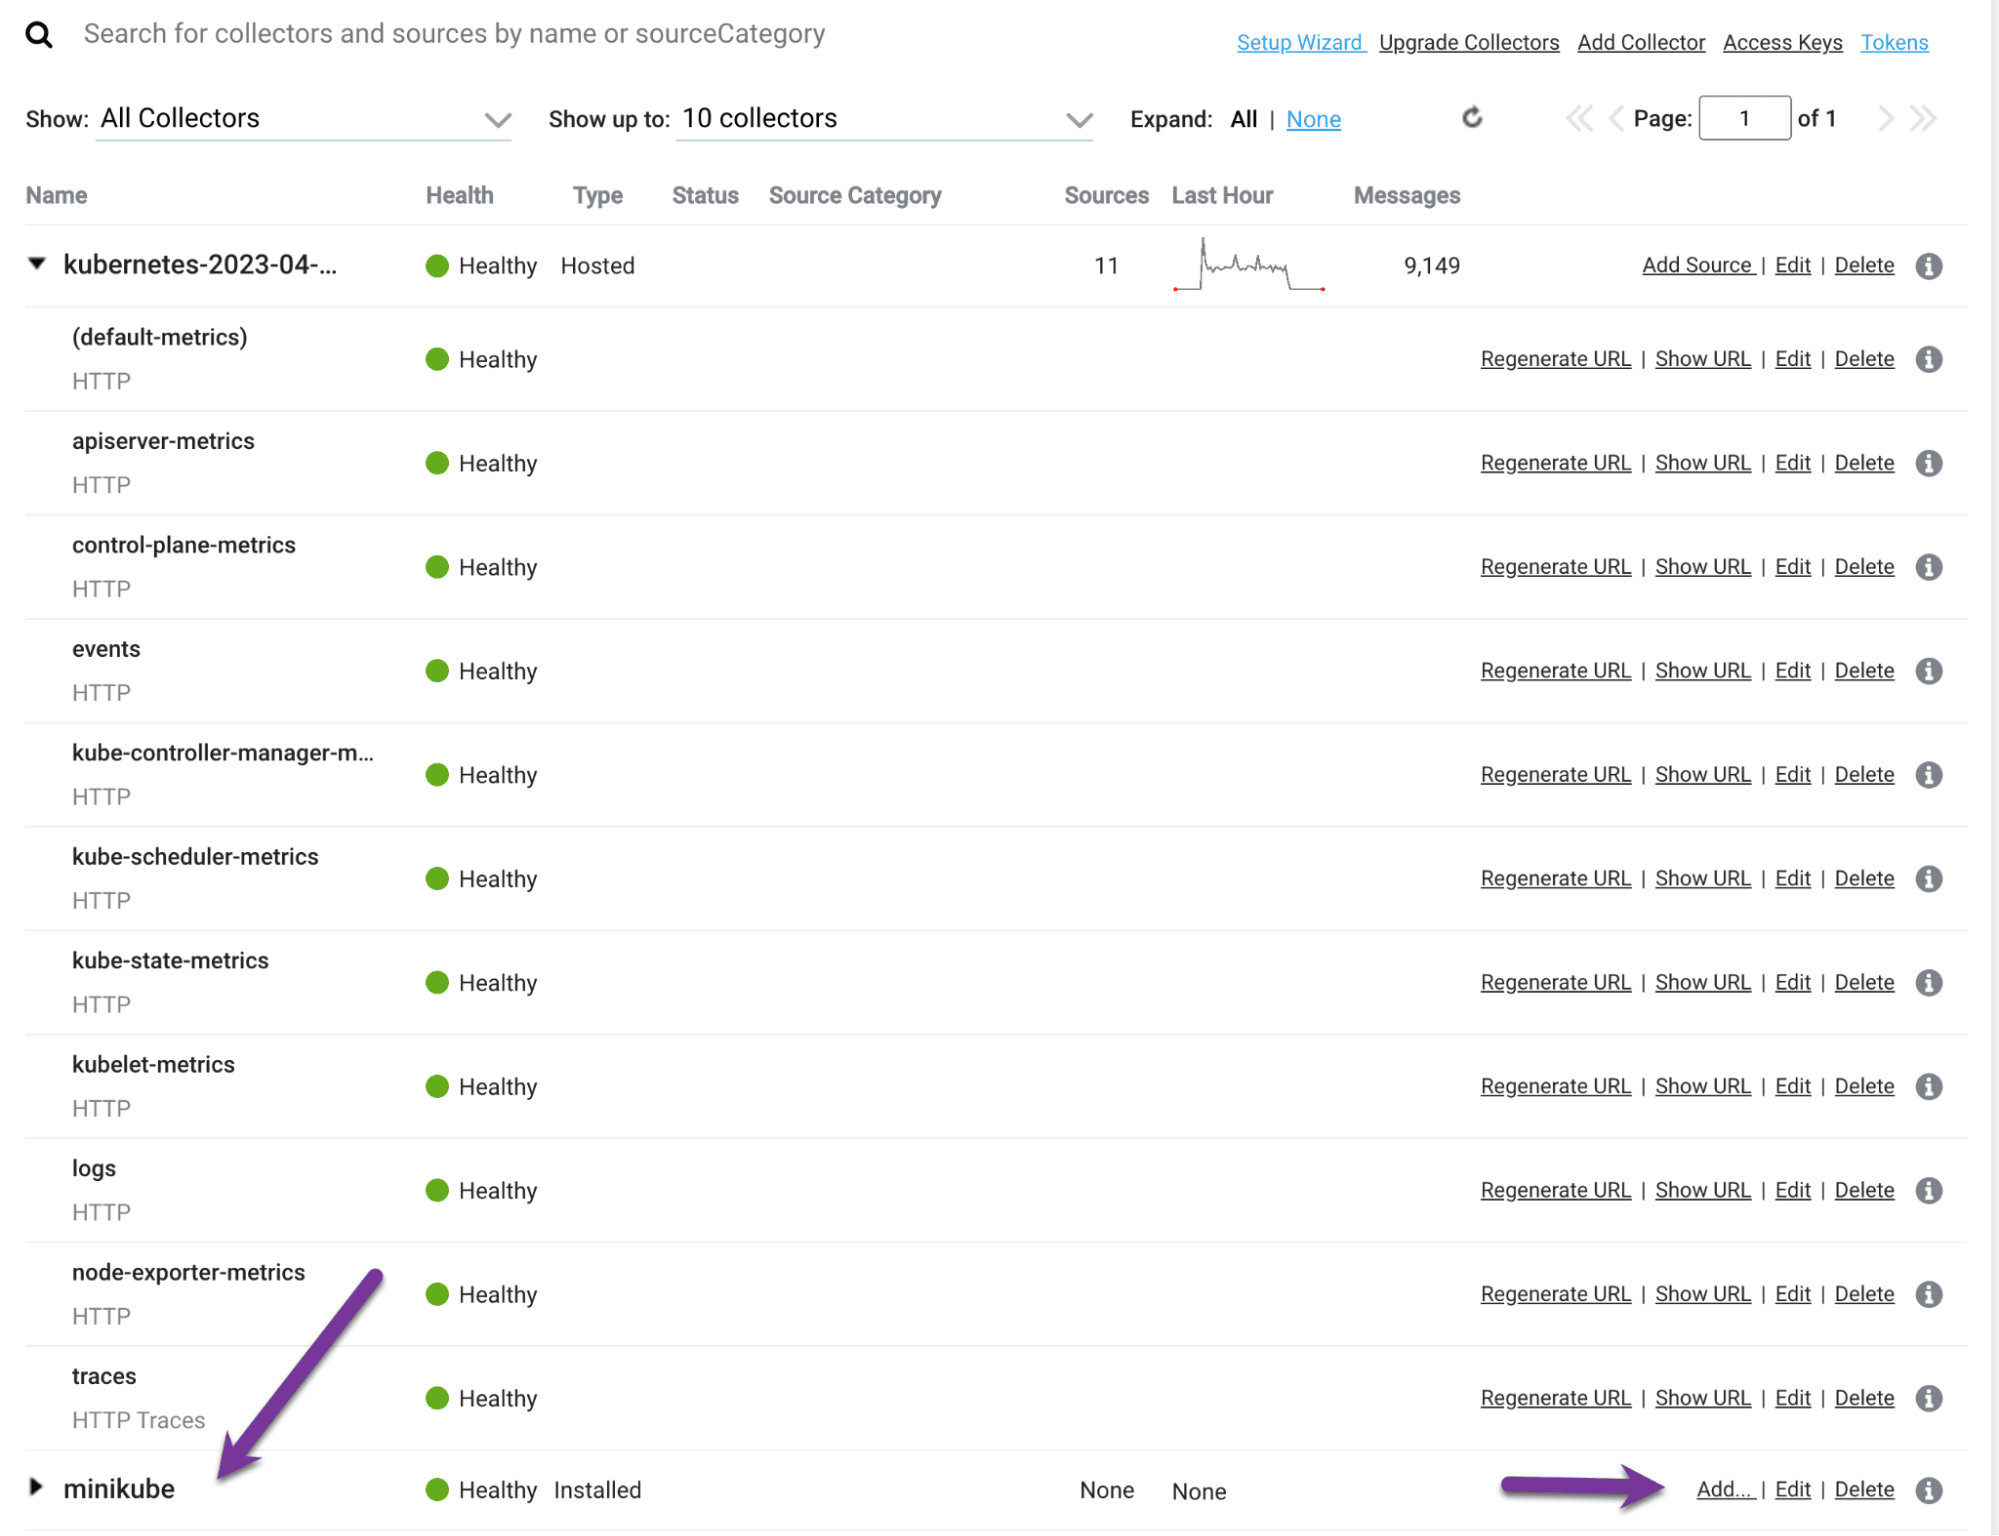
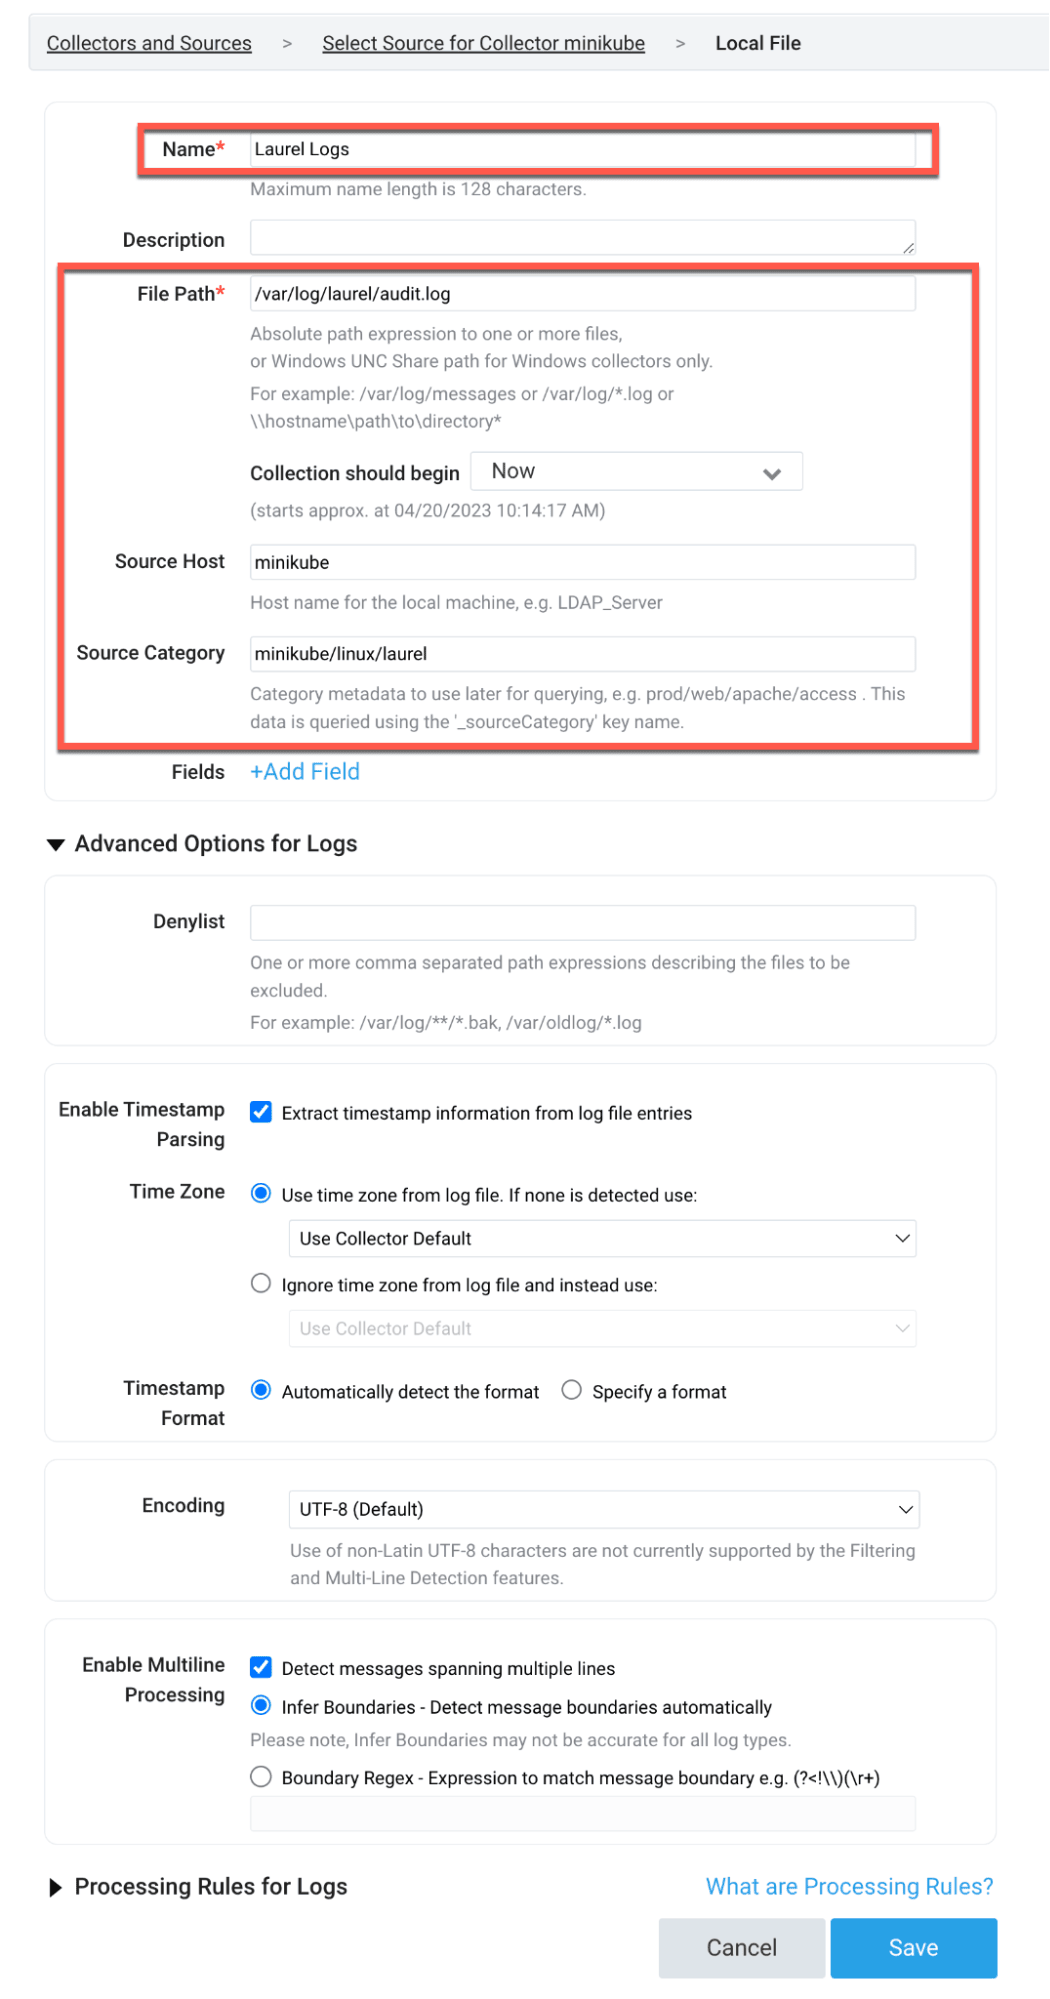
Configure a new source to collect the Laurel JSON logs:
Practical Attack Scenarios
Now that we have our lab set up and our telemetry flowing, let’s execute some offensive security scenarios to test our detection capabilities. We will be using the MITRE ATT&CK framework to categorize our attacks.
T1610 - Deploy Container
The first technique we will test is T1610, Deploy Container. This technique involves deploying a container to the Kubernetes cluster, which could be used by an attacker to establish persistence or run malicious workloads.
We can detect this at the Kubernetes level by looking for object creation events:
_collector="kubernetes-2023-04-20T12:54:16.324Z"
| %"object.reason" as reason
| %"object.involvedobject.kind" as object_kind
| %"object.involvedobject.name" as object_name
| where reason = "Created"
| where !(object_name matches /(coredns|etcd|my-release|kube-|storage-provisioner)/)
| values(object_kind) as kinds,values(object_name) as names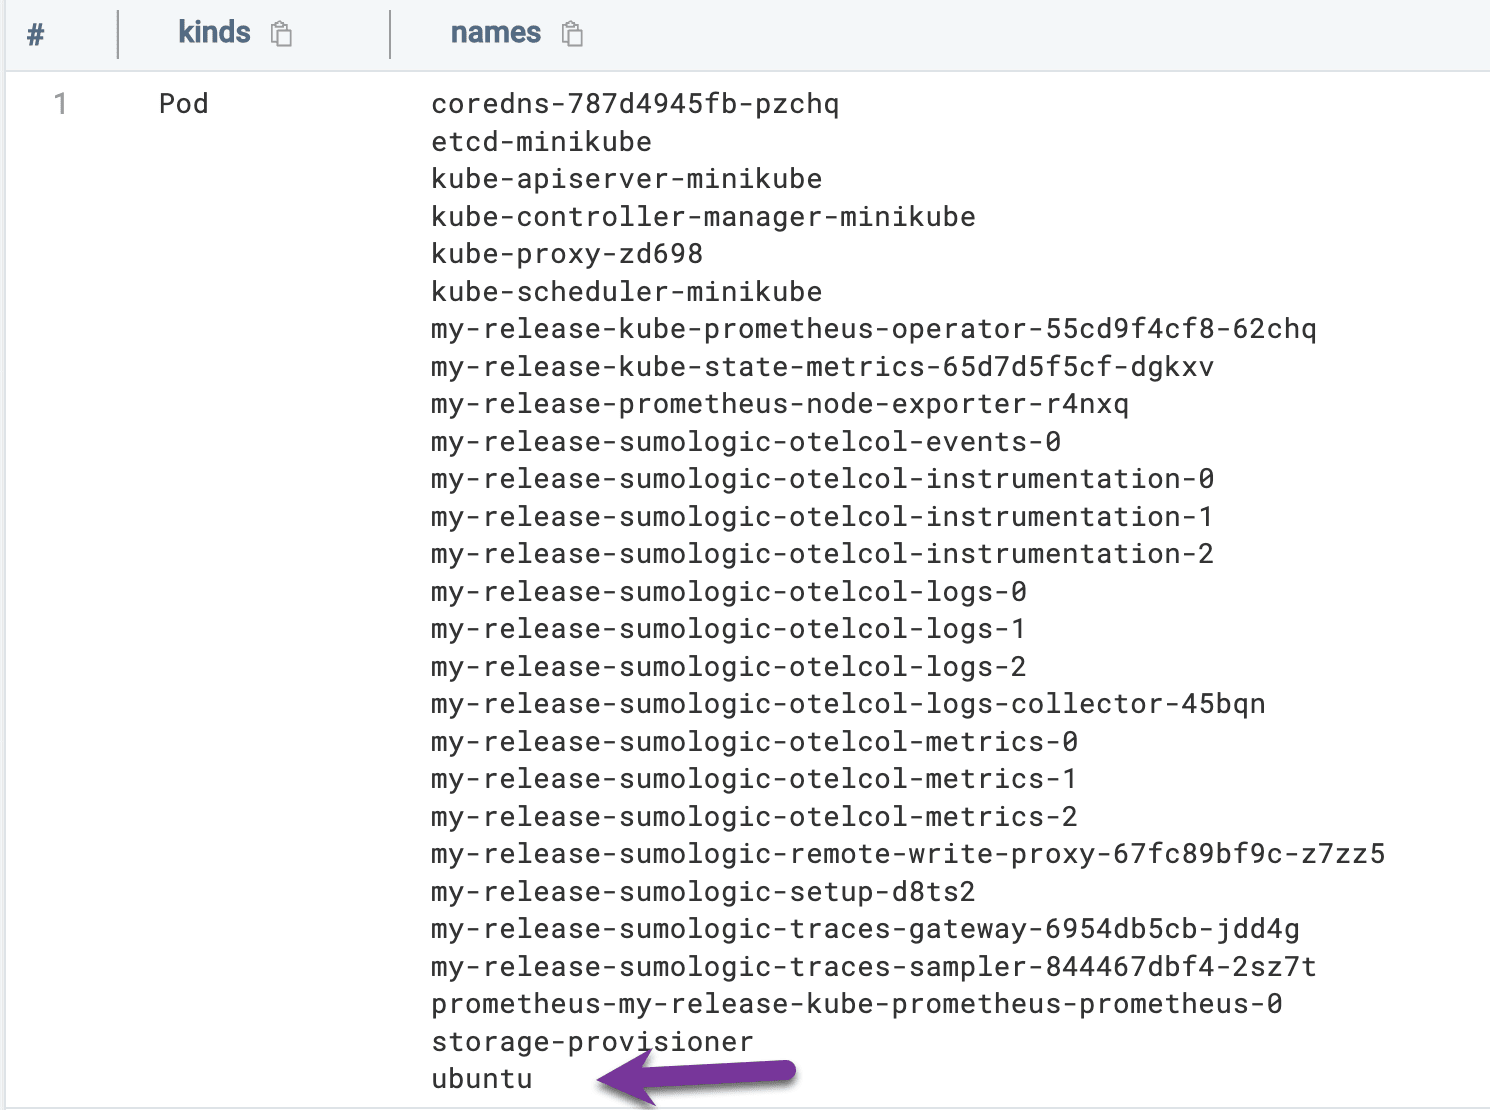
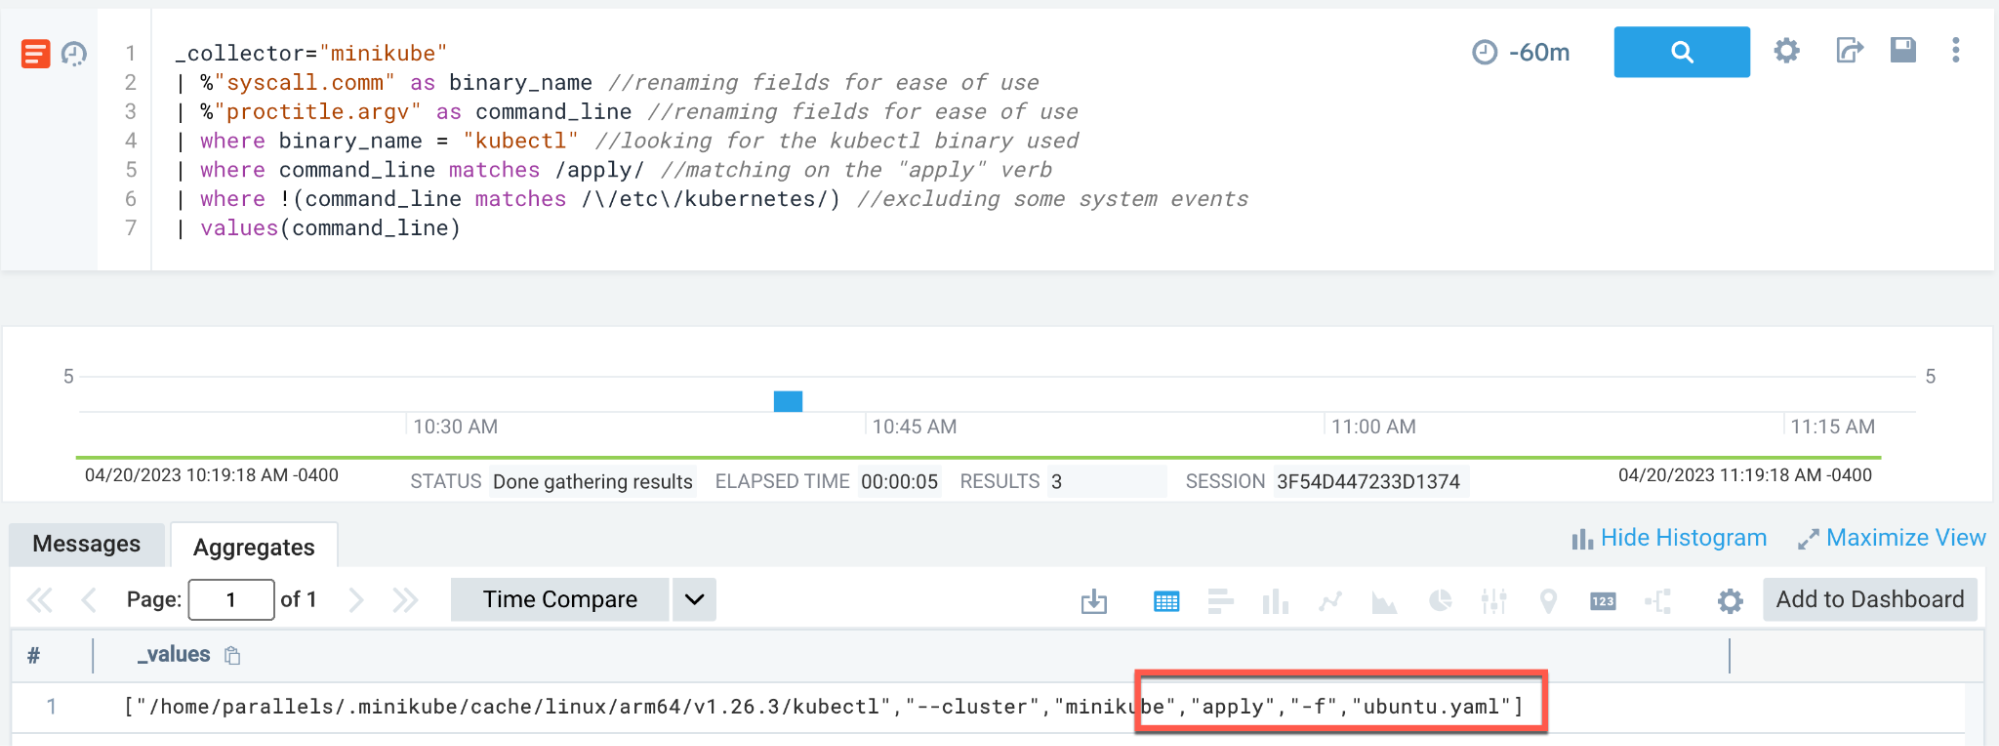
We can also detect this at the host level by looking for kubectl apply commands:
_collector="minikube"
| %"syscall.comm" as binary_name
| %"proctitle.argv" as command_line
| where binary_name = "kubectl"
| where command_line matches /apply/
| values(command_line)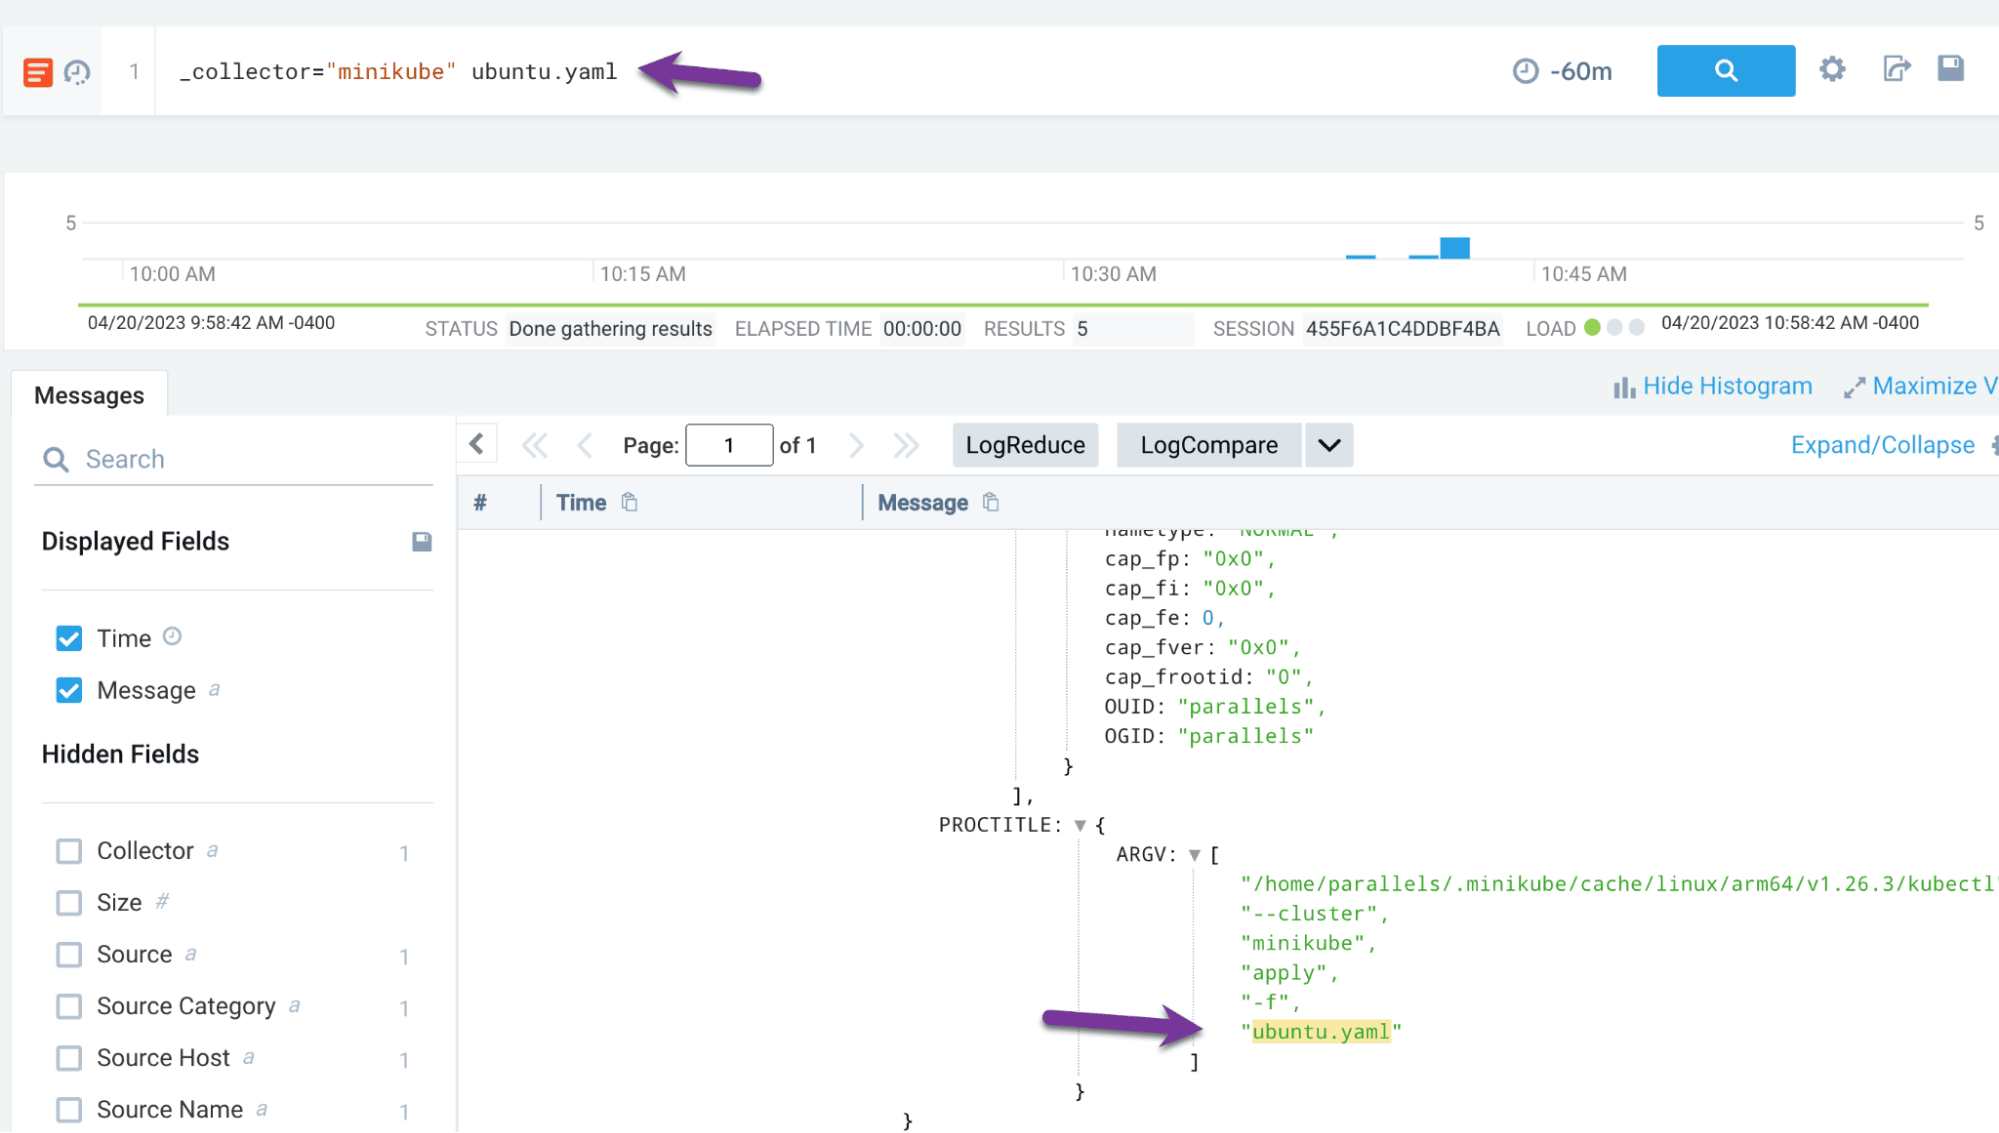
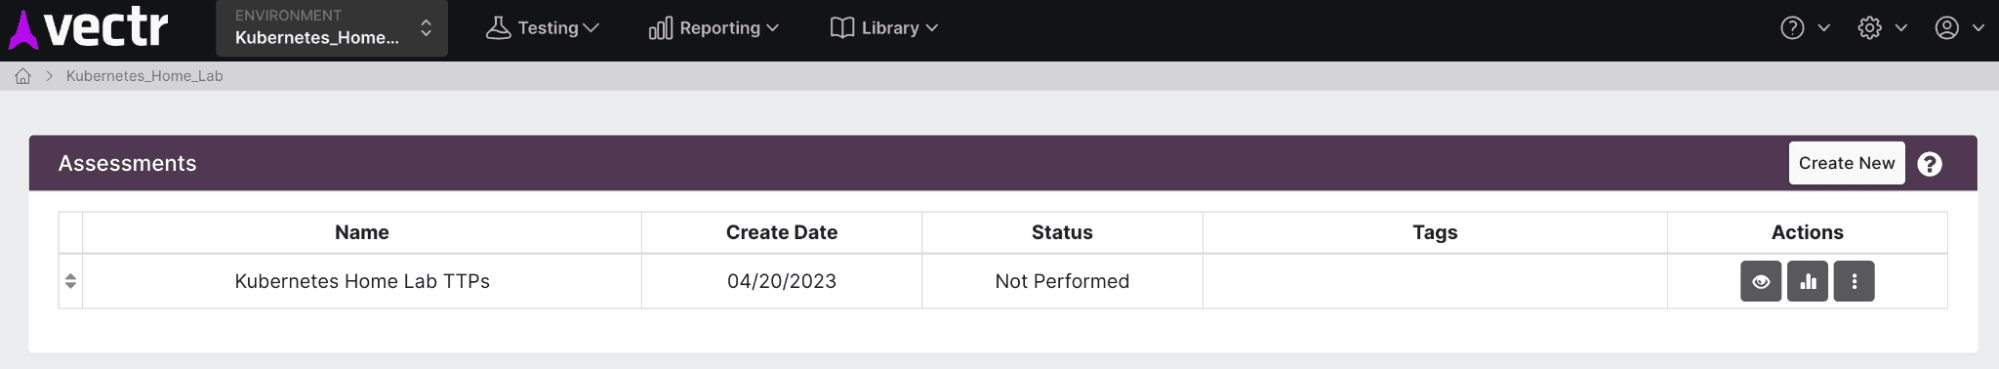
Now let’s track this in Vectr. First, create a new assessment:
Then create a campaign and test case:
Fill in the details of the test case, including the technique ID, attack method, and detection results:

T1609 - Container Administration Command
The next technique we will test is T1609, Container Administration Command. This technique involves executing commands within a running container, which could be used by an attacker to interact with compromised workloads.
First, we need to add an audit rule to track minikube execution:
# Add to audit rules:
-w /usr/local/bin/minikube -p x -k minikube

sudo pkill -HUP auditd
Now we can execute a command to get a shell within our Ubuntu pod:
kubectl exec -it ubuntu -- /bin/bash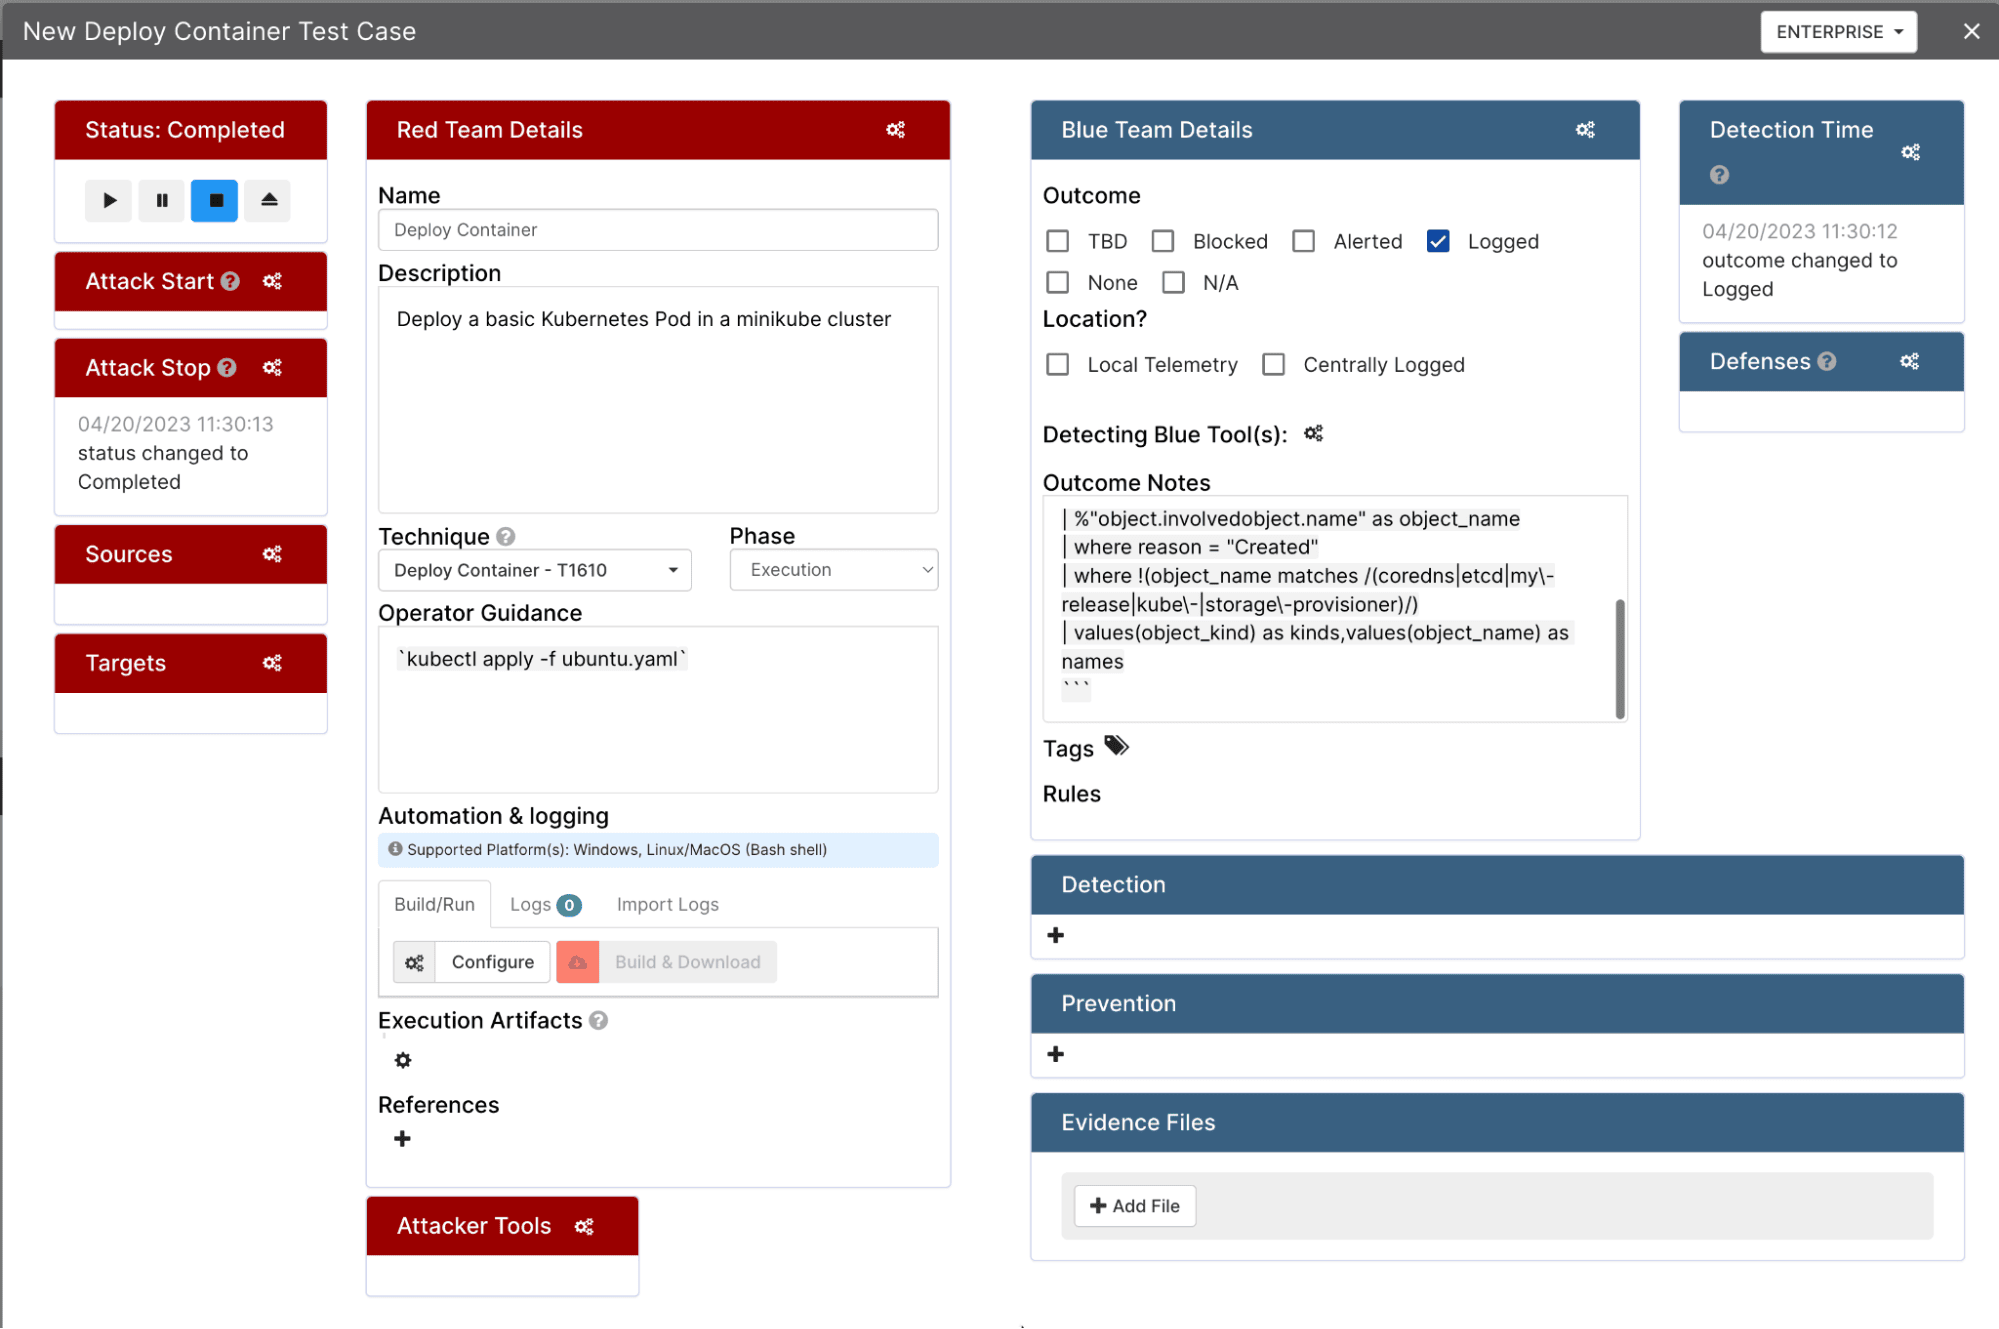
We can detect this at the host level by looking for minikube commands with exec, tty, or stdin parameters:
_collector="minikube"
| %"syscall.comm" as binary_name
| %"proctitle.argv" as command_line
| where binary_name = "minikube"
| where command_line matches /exec|tty|stdin/
| values(command_line) as command_line,values(binary_name) as binary_name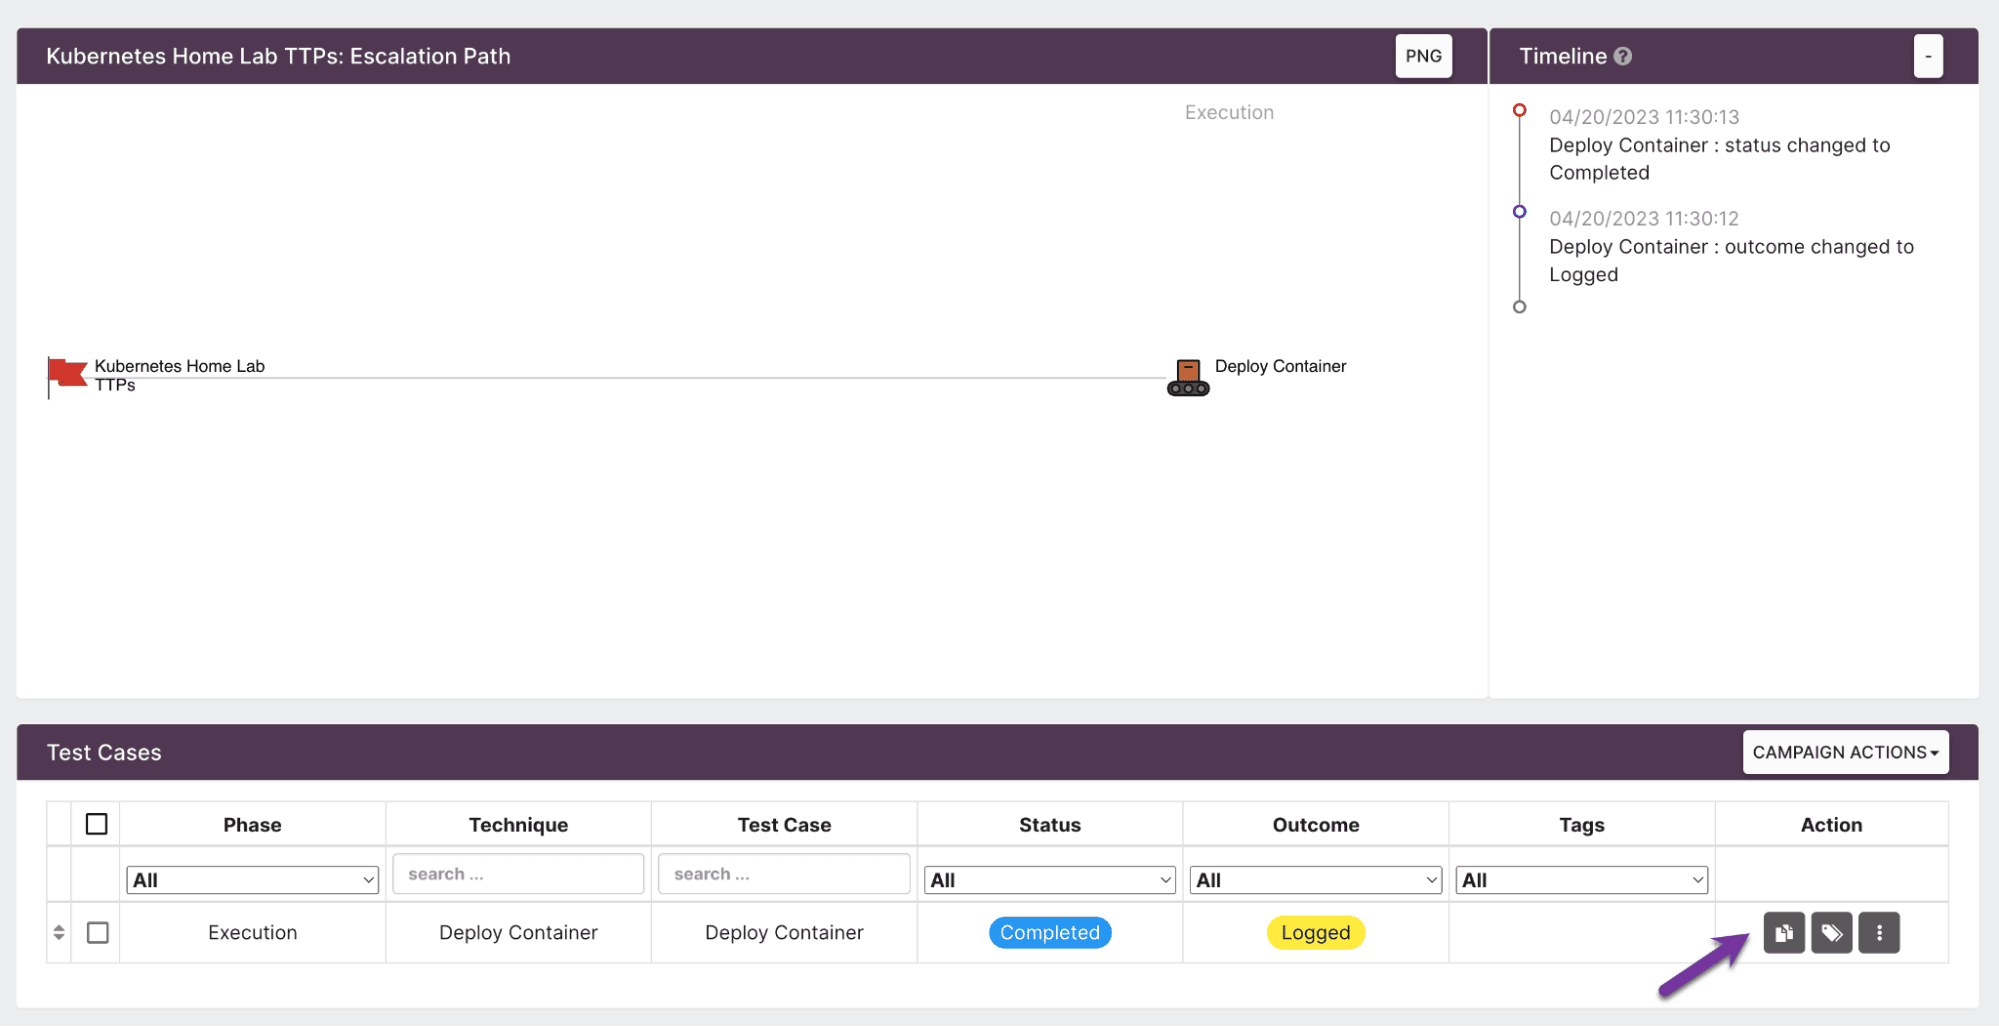
T1613 - Container and Resource Discovery
The next technique we will test is T1613, Container and Resource Discovery. This technique involves enumerating resources within a Kubernetes cluster, which is commonly performed by attackers during the reconnaissance phase.
We can execute the following enumeration commands:
kubectl config get-users
kubectl config get-clusters
kubectl auth can-i --list
kubectl get roles
kubectl get secrets
kubectl get serviceaccounts
kubectl get deployments
kubectl get pods -A
To detect this activity, we can use a time-based scoring approach that assigns points to different types of enumeration commands:
_collector="minikube"

| 0 as score
| "" as messageQualifiers
| "" as messageQualifiers1
| "" as messageQualifiers2

| timeslice 1h

| %"syscall.comm" as binary_name
| %"proctitle.argv" as command_line

| where binary_name = "minikube"

| if(command_line matches /(can-i)/,concat(messageQualifiers, "Kubectl auth enumeration: ",command_line,"\nBy Binary: " ,binary_name,"\n# score: 3\n"),"") as messageQualifiers
| if(command_line matches /(get)/,concat(messageQualifiers1, "Kubectl cluster enumeration: ",command_line,"\nBy Binary: " ,binary_name,"\n# score: 3\n"),"") as messageQualifiers1
| if(command_line matches /(config)/,concat(messageQualifiers2, "Kubectl config enumeration: ",command_line,"\nBy Binary: " ,binary_name,"\n# score: 3\n"),"") as messageQualifiers2

| concat(messageQualifiers,messageQualifiers1,messageQualifiers2) as q

| parse regex field=q "score:\s(?<score>-?\d+)" multi

| where !isEmpty(q)

| values(q) as qualifiers,sum(score) as score by _timeslice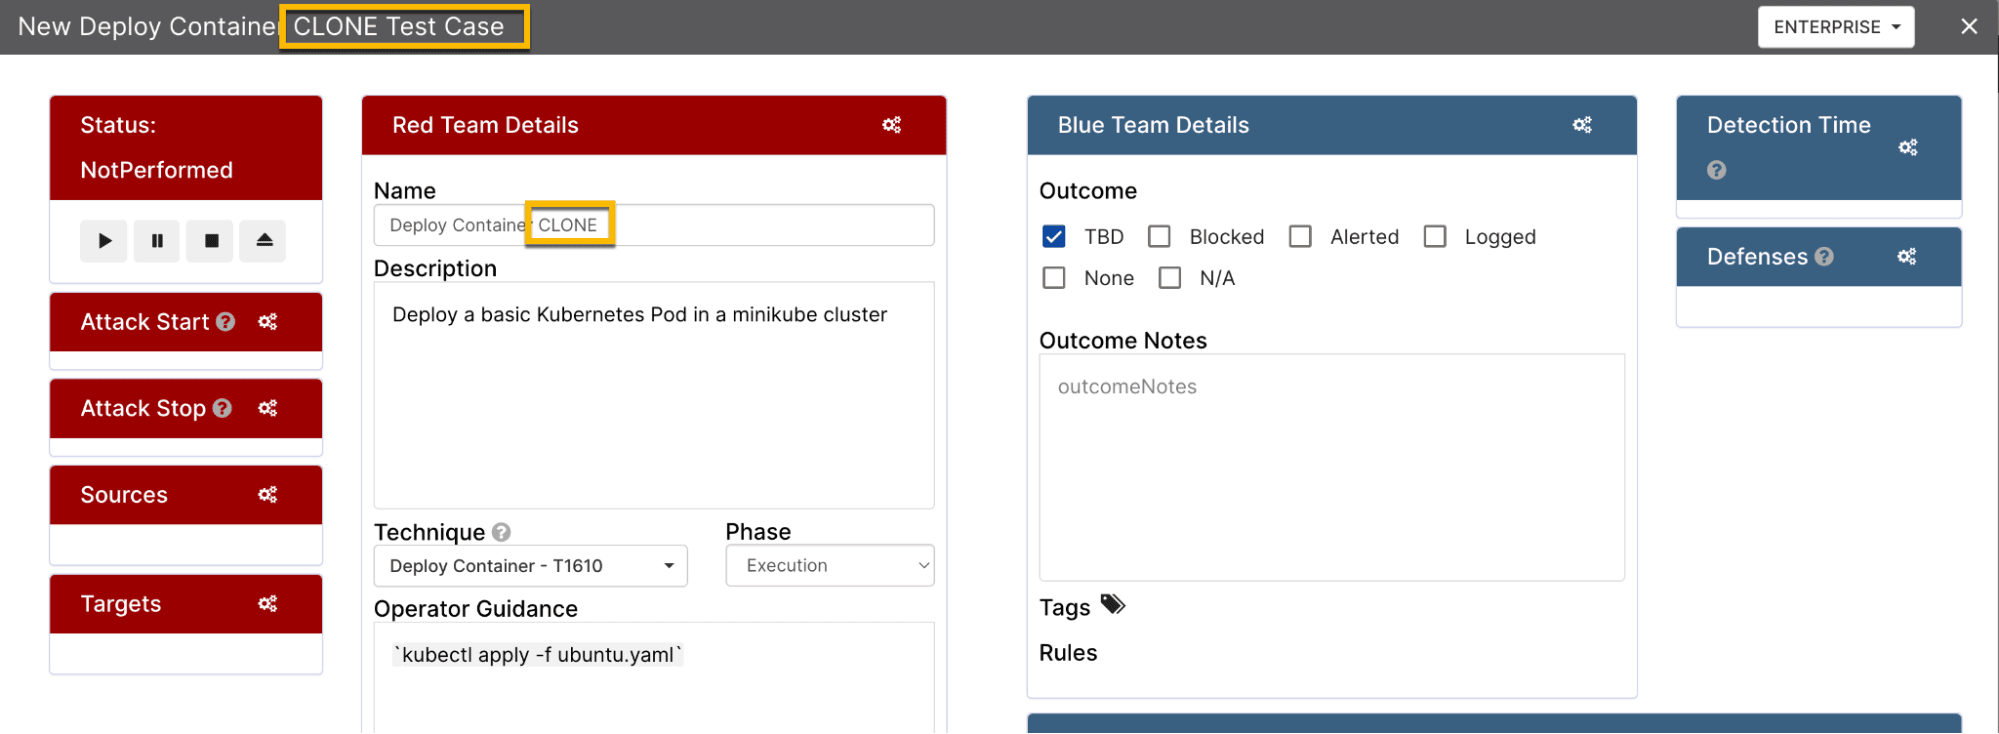
T1496 - Resource Hijacking
The final technique we will test is T1496, Resource Hijacking. This technique involves using cluster resources for purposes such as cryptocurrency mining. We can simulate this by deploying a stress test pod that consumes CPU resources.
apiVersion: apps/v1
kind: Deployment
metadata:
  name: stress-deployment
spec:
  replicas: 5
  selector:
    matchLabels:
      app: stress
  template:
    metadata:
      labels:
        app: stress
    spec:
      containers:
      - name: stress
        image: polinux/stress
        resources:
          requests:
            memory: "64Mi"
            cpu: "500m"
          limits:
            memory: "128Mi"
            cpu: "1000m"
        command: ["stress"]
        args:
          - "--cpu"
          - "1"
          - "--timeout"
          - "600s"
Vectr Wrap-Up
After executing our attack scenarios and tracking the results in Vectr, we can generate a MITRE ATT&CK coverage report. This report shows which techniques we tested and whether our detections were successful.
Vectr also allows us to export our results as a JSON layer that can be imported into the MITRE ATT&CK Navigator, providing a visual representation of our detection coverage.
Final Thoughts
In this post, we walked through how to set up a local Kubernetes purple teaming lab. We installed and configured Docker, Minikube, Auditd with Laurel, Vectr, and Sumo Logic to create a comprehensive monitoring environment.
We then executed several offensive security scenarios based on the MITRE ATT&CK framework, including deploying containers (T1610), executing container administration commands (T1609), performing resource discovery (T1613), and simulating resource hijacking (T1496).
The key takeaway is that local, cost-effective infrastructure can support comprehensive security testing. The combination of host-level and container-level visibility provides defense-in-depth insights that might not be available in production cloud environments. Practitioners can snapshot virtual machines to preserve configurations and rapidly test detection scenarios across different attack chains.
References
- https://docs.docker.com/engine/install/ubuntu/
- https://minikube.sigs.k8s.io/docs/start/
- https://linux.die.net/man/8/auditd
- https://github.com/Neo23x0/auditd/blob/master/audit.rules
- https://github.com/threathunters-io/laurel
- https://github.com/SecurityRiskAdvisors/VECTR
- https://helm.sh/docs/intro/install/
- https://help.sumologic.com/docs/observability/kubernetes/