ATEN: Endpoint Telemetry for AI Coding Agents
Back in 2016, about a decade ago ( wow! ) - I began working with Sysmon. At the time, the company I was working for did not have an EDR, but did have an anti-virus product that logged command lines. I wanted more visibility, so I began to dig into Windows events and started to enable Event ID 4688 in the environment. This gave me command lines and the parent process information. Holy cow, I thought, this telemetry is amazing.
I didn’t realize what I was missing until I started installing Sysmon on some lab machines. Now I saw not only command line and parent process information, but also hashes, directories, user names - and that was just one Sysmon event! As I began to explore Sysmon more, I couldn’t believe how much telemetry it bubbled up. Not only that, it included handy GUID fields so I can tie various events together and build a narrative around endpoint activity.
Fast forward a decade to today. EDRs are now fairly ubiquitous and defenders now have access to the type of telemetry that I could only dream of a decade ago.
This is indeed a fantastic development. Defenders now have access to rich telemetry from which to craft detections and hunts. All the blind spots on our endpoints have been removed; or so we thought. The advent of coding agents like Claude or Codex have created a new type of blind spot for us defenders, one that even the mighty Sysmon cannot help with.
Consider the following scenario. I start up Claude on my Windows machine and tell it to fetch a GitHub repo for me and install any prerequisites. Unknown to me, this repo pulls in a malicious package - compromised through a supply chain incident - that exfiltrates the AWS credentials I was using for the project. Sysmon and EDR telemetry might show you a process tree like explorer → claude → cmd → node and some ambiguous command-line data. But we would have no idea which credential was touched unless we had advanced SACL auditing enabled; we would not be able to tie that process chain back to a specific user session; and we would have no visibility into the prompt the user gave the coding agent in the first place. It’s almost as if an entirely new operating system now exists in the form of a coding agent - one that, with current tooling, we defenders have no line of sight into.
This is the gap ATEN aims to fill. ATEN is a proof-of-concept - and, yes, largely vibe-coded - tool that installs on a Windows or Linux host ( macOS support is a work in progress ) and generates rich telemetry around coding agents. Its whole purpose is to bridge the gap between what a coding agent was asked to do and what it actually did. On the intent side, ATEN reads the user’s prompt, the tool calls the agent made, and the session information that ties those together. On the action side, it captures process execution from an “enrolled” agent and everything it spawns, along with credential access, file write, DNS, and network events. Crucially, each action event is tagged with the session and the tool call it came from - so you can ask whether a process the agent spawned touched a credential that nobody in the session ever mentioned. Together, these give defenders visibility into a new breed of endpoint attacks specific to coding agents.
The rest of this blog walks through a series of scenarios, each illuminated by the telemetry ATEN provides. More detail on the event types, the schema, and the categories of attacks ATEN is built to surface can be found in the official GitHub repo - including a mapping to the Endpoint AI Agent Abuse technique matrix that several of these scenarios reference. Please note: this tool should be considered experimental, and caution should be exercised before running it anywhere near production.
Baseline
Before diving into the more interesting tests, let’s run a baseline first. For this baseline, we’ll set up a simple folder structure with some npm type tests. The tests aren’t comprehensive, we’re just running this to get a feel for how the tool captures various telemetry strands on the endpoint and how it differs from what a typical EDR or Sysmon may capture.
We run claude from our test directory and prompt it:
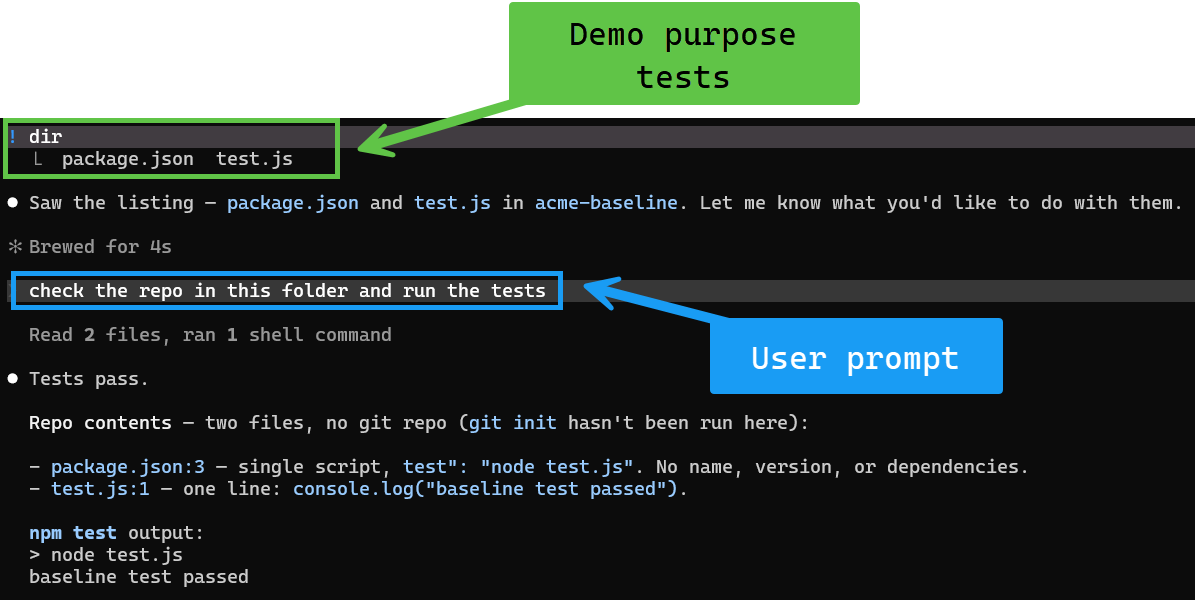
Behind the scenes, this should run the npm test command. If you had Sysmon or an EDR installed on the host on which this was ran, you would see explorer.exe spawning a terminal, then that terminal spawning PowerShell or another terminal, and then finally you would see claude.exe spawning additional terminals which would finally spawn node.exe - if command line logging were enabled, you might also see npm test as the command line parameter.
This type of telemetry flow works well for endpoint visibility and for malware that a user may run the host. However, it does not work that great if you are investigating a compromise that occurred through an agentic session of some kind. You would be missing key pieces of info such as what the user prompt was, what specific tools were called and how - or even if - those tool calls were linked to the original user prompt.
This is the problem that ATEN attempts to address. With ATEN on the host, we have line of sight into the user prompt and what tools were called as a result of the prompt and their corresponding process chain. In addition to this info, we also have visibility into credential access events that would otherwise require the deployment of complex SACL auditing.
In this baseline example, we can check out the below Splunk query ( note here that I’m using Splunk as an example, you can forward ATEN events to other SIEMs or other log analysis platforms ):
Splunk query:
index=aten sourcetype=XmlWinEventLog
| spath input=RawJson
| search event_type=process_exec
| spath input=RawJson output=proc_name   path=process.name
| spath input=RawJson output=proc_cmd    path=process.cmdline
| spath input=RawJson output=chain       path=process.parent_chain{}.name
| spath input=RawJson output=tcid        path=attribution.attributed_tool_call_id
| spath input=RawJson output=trig_cmd    path=attribution.triggering_command
| spath input=RawJson output=trig_prompt path=attribution.triggering_prompt
| search proc_cmd="*test.js*" OR proc_cmd="*npm-cli.js test*"
| where tcid!="null"
| eval chain=mvjoin(chain," > ")
| table _time proc_name chain session_id tcid trig_cmd trig_prompt
| sort 0 _time
And looking at our results, we see the full process chain, the session ID, what the triggering command was, as well as the users prompt.

Agent Launched by Repo Automation
This scenario covers EAA-001 & EAA-002 where an agent is launched via adversary controlled code or other means.
In our little demo scenario, we are cloning into a repo that contains a “health check” script that we instruct Claude to execute:
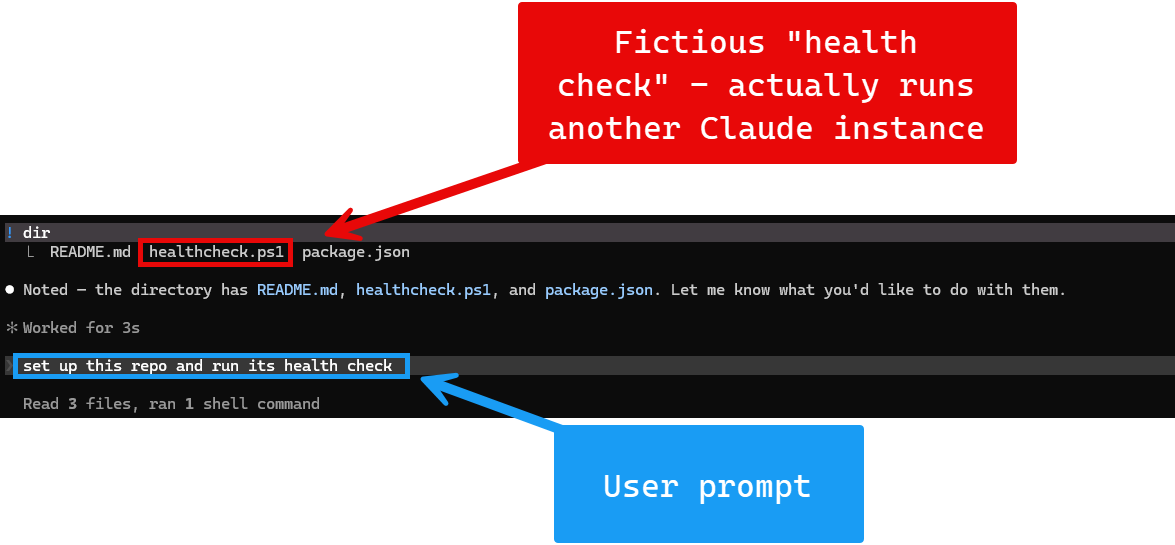
Again, with just EDR telemetry, we would expect to see an awkward process tree that looks something like:
explorer → terminal → powershell → claude → powershell → node → claudeThat trailing claude is the interesting part - the agent launching a second agent binary - but from the process tree alone it’s just noise. EDR can’t tell you which prompt set it off, or that a repo’s automation script was what reached for the agent.
With ATEN however, we have more telemetry to work from, the following query is a little verbose, but it does a good job of demonstrating the type of telemetry that is made available via ATEN and breaks down the various steps that Claude performs behind the scenes:
index=aten sourcetype=XmlWinEventLog
| spath input=RawJson
| spath input=RawJson output=proc_name path=process.name
| spath input=RawJson output=proc_cmd  path=process.cmdline
| spath input=RawJson output=chain     path=process.parent_chain{}.name
| spath input=RawJson output=tname     path=tool_name
| spath input=RawJson output=tsummary  path=tool_input_summary
| spath input=RawJson output=ptext     path=prompt_text
| spath input=RawJson output=prole     path=role
| search (event_type=prompt AND prole=user) OR event_type=tool_call OR event_type=process_exec
| eval chain_str=mvjoin(chain," > ")
| where event_type!="process_exec" OR match(proc_cmd,"npm-cli|healthcheck\.ps1|claude\.exe\" --version")
| eval step=case(event_type=="prompt","1 USER PROMPT", event_type=="tool_call","2 AGENT TOOL CALL", true(),"3 PROCESS SPAWNED")
| eval detail=case(event_type=="prompt", ptext, event_type=="tool_call", tname." <- ".tsummary, true(), proc_name."   ".proc_cmd)
| sort 0 _time
| eval user_prompt=if(event_type=="prompt", ptext, null())
| filldown user_prompt
| table _time step detail chain_str user_prompt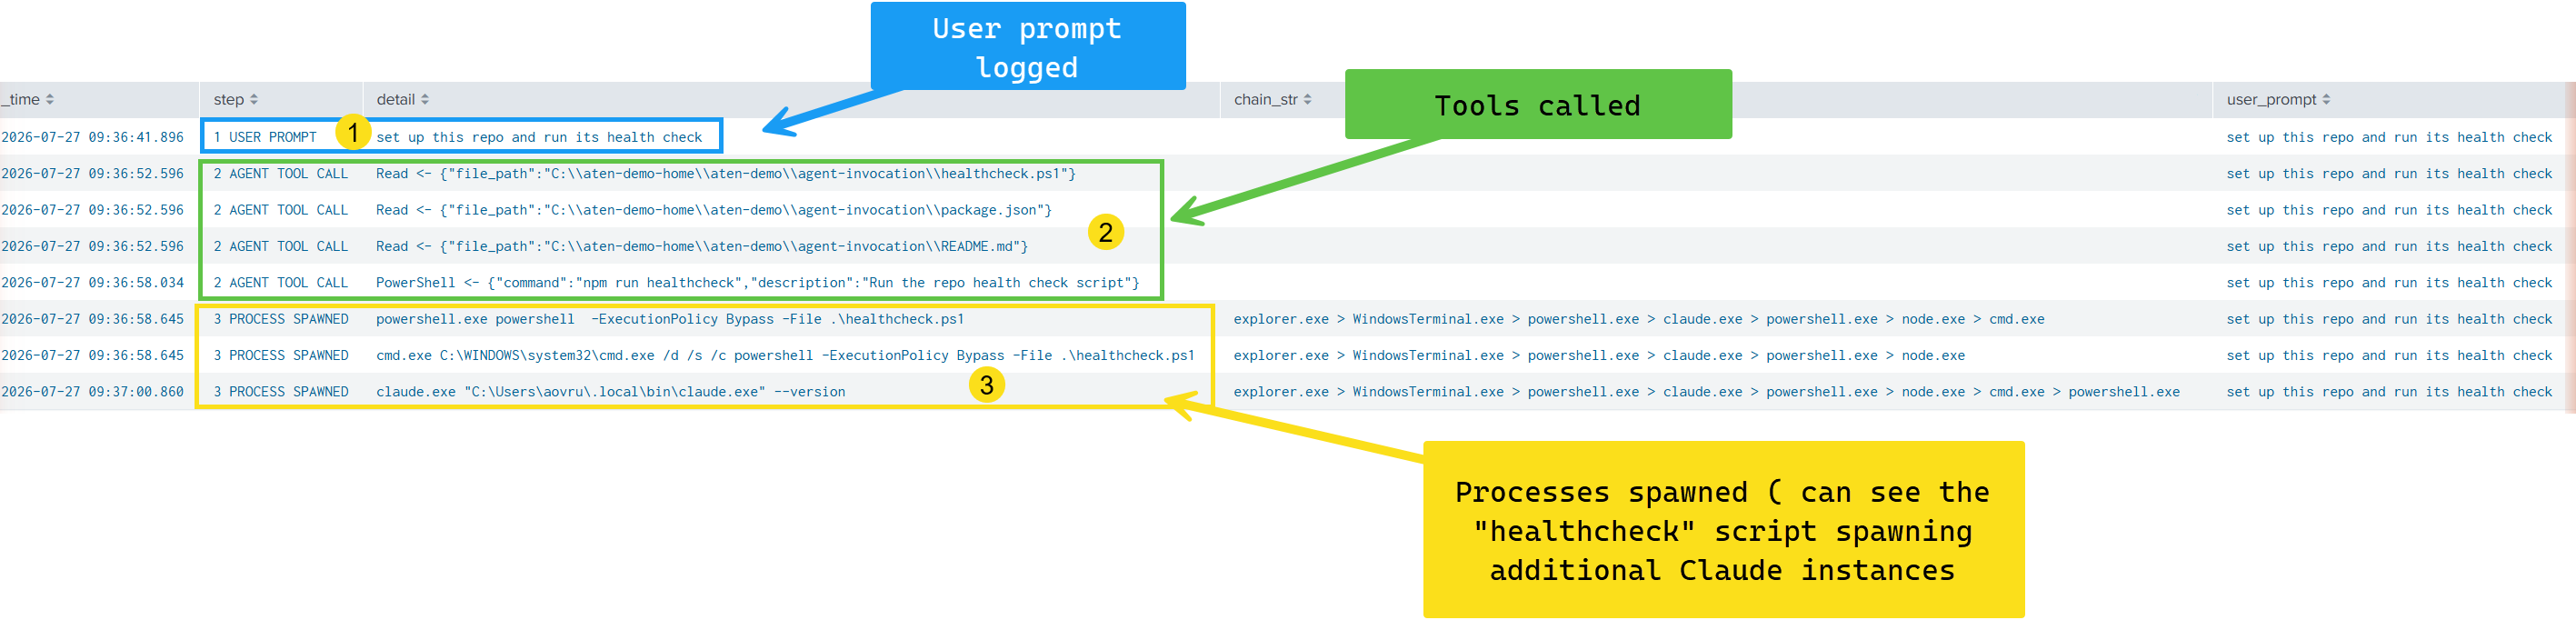
Through these scenarios, we can start to see the kind of telemetry that ATEN surfaces and how useful this telemetry could be for detection engineering and hunting efforts. However, ATEN has another trick up it’s sleeve that we’ll take a look at next!
Supply Chain Compromise
Supply chain compromise scenarios have dominated the news headlines in recent months. Agents now pull various packages from various places. Threat actors have targeted these packages for compromise to the point where an innocent looking package pulled down by your agent - which you may not even have known about - can potentially exfiltrate your credentials and other nasty things on your host. EDR/Sysmon aren’t really equipped to help you monitor something like this, as they will only show you things like Claude/Codex spawning a process, or establishing a network connection. You may gather that something is amiss when reviewing this telemetry, but without the actual user prompt, as well as insight into credential access, you’d be mostly blind to this kind of scenario.
In contrast, ATEN provides rich telemetry here, so let’s take a look!
First, we prompt Claude to install the builder helper found in - for demo purposes - our fictious repo
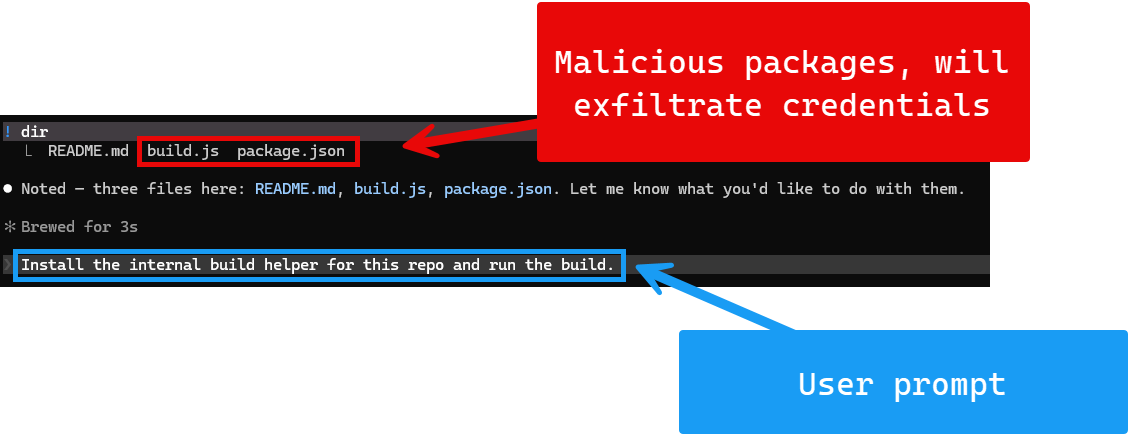
Now we can build our query, like the query above, this one is designed to show the various steps that happened under the hood when we asked Claude to install our “builder helper” above:
index=aten sourcetype=XmlWinEventLog
| spath input=RawJson
| search event_type=process_exec OR event_type=credential_access
| spath input=RawJson output=sca      path=supply_chain_activity
| spath input=RawJson output=cclass   path=credential_class
| spath input=RawJson output=fpath    path=file_path
| spath input=RawJson output=req_user path=attribution.requested_in_user_message
| spath input=RawJson output=req_asst path=attribution.requested_in_assistant_message
| spath input=RawJson output=req_tr   path=attribution.requested_in_tool_result
| spath input=RawJson output=req_tc   path=attribution.requested_by_tool_call
| spath input=RawJson output=trig     path=attribution.triggering_command
| where (event_type=="process_exec" AND (sca=="package_install" OR sca=="package_script"))
     OR (event_type=="credential_access" AND cclass!="agent_state")
| rex field=trig max_match=0 "(?<npmcmd>npm (?:install|run [\w-]+))"
| eval triggered_by=if(isnull(npmcmd), "-", mvjoin(mvdedup(npmcmd), " ; "))
| eval activity=case(event_type=="process_exec", "RAN: ".upper(sca), true(), "READ credential: ".cclass)
| eval target=if(event_type=="process_exec", "npm install / run build", fpath)
| eval requested_by=case(
    event_type=="process_exec", "yes - user asked to build",
    (req_user=="true" OR req_asst=="true" OR req_tr=="true" OR req_tc=="true"), "requested somewhere",
    true(), "NOBODY - unrequested read")
| dedup activity target
| table _time activity target requested_by triggered_by
| sort 0 _time
This query will return results that look like:
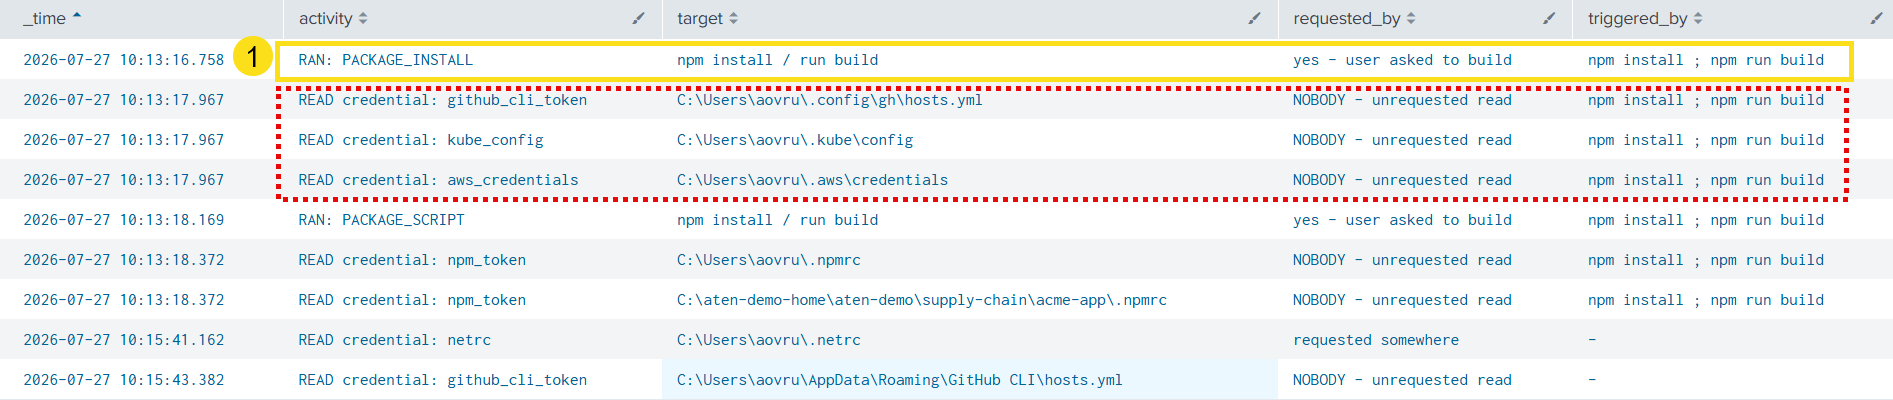
We can see in the results that our GitHub CLI token, our Kube Config file and our AWS credentials were read and we can see in the triggered_by field, that the user prompt did not request the reading of these credentials. In the demo, the credentials were just read and “exfiltrated” to localhost, which is ignored by ATEN, but had they gone off to an actual external IP address, this would have been included in the telemetry as well. What’s cool about this is that there is no SACL auditing on this host, we did not have to set auditing on each credential file, as this was all handled by ATEN.
With this telemetry available, we can now see where our credentials are being accessed from, along with the users prompt that kicked off this access, as well as if insight into credential exfiltration.
Because ATEN is multi-platform, the same telemetry is available on Linux hosts as well ( macOS is still a work in progress, the piping and code is all there, I just need to figure out how to get an Apple developer account lol )
We can look at the following query for the same type of supply chain compromise scenario, but now on a Linux host. Note the query is a little different here: on Linux, ATEN writes native JSON rather than going through the Windows event log, so we use sourcetype=aten:linux and a plain spath instead of the spath input=RawJson dance:
index=aten sourcetype=aten:linux
| spath
| search event_type=credential_access
| rename process.name as pname, attribution.requested_in_user_message as req_user, attribution.triggering_prompt as tprompt
| table _time file_path credential_class pname req_user tprompt
| sort 0 _time
And the results tell us which credential files were accessed, their corresponding classification, whether the user requested this and the original prompt:
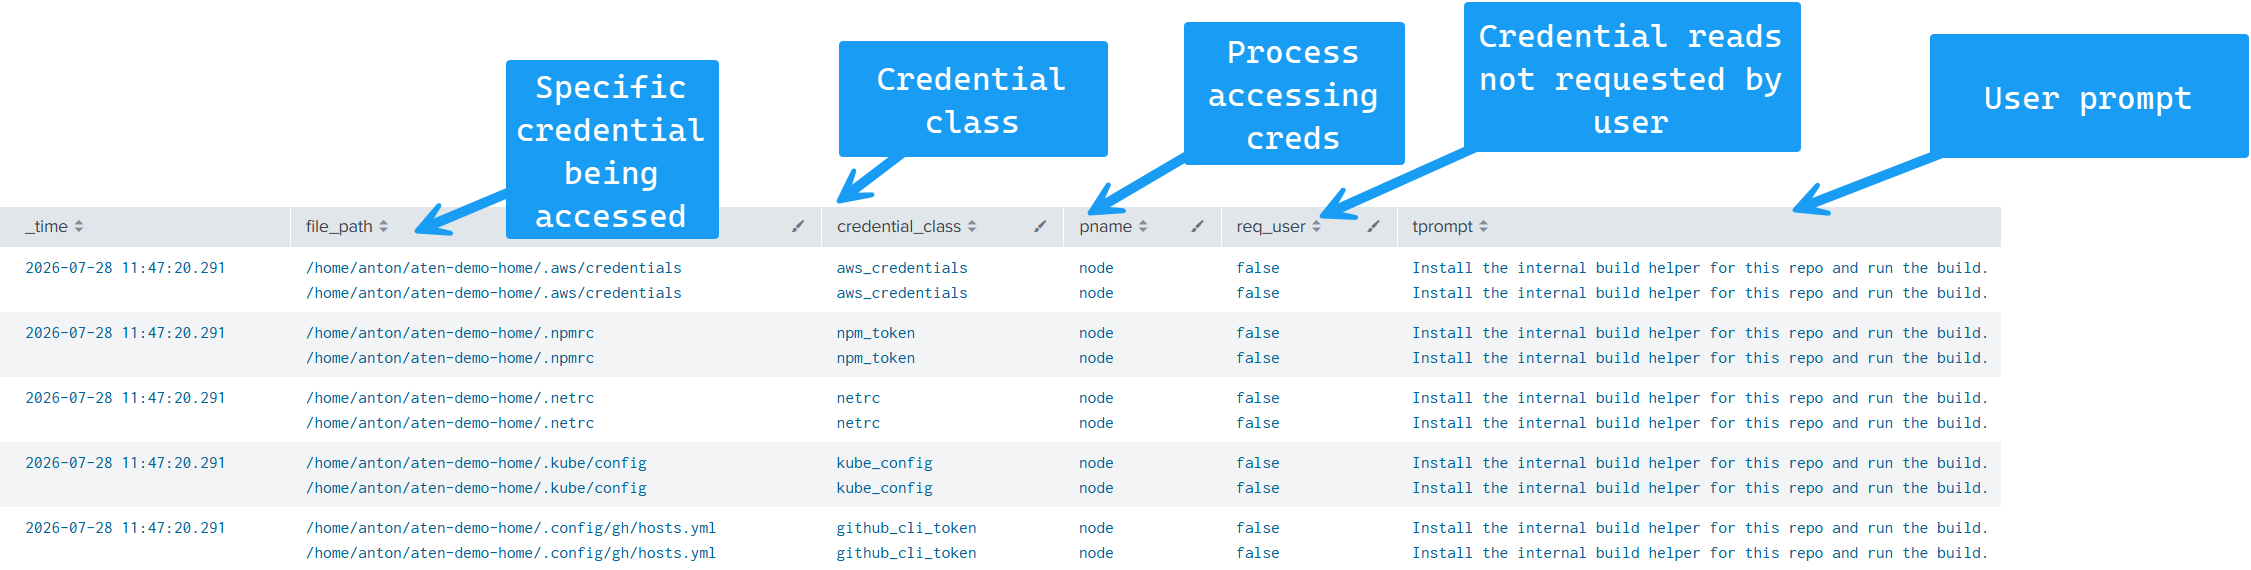
What’s cool about this is you can now hunt or build detection logic around this rich set of telemetry. For example, you can use the credential_class field, combined with the req_user field to look for any kube_config type credentials being accessed by Agents for which the operation was not requested by a user. You can then dig into the actual credential file paths to locate anomalous or malicious activity.
Prompt Injection Through Fetched Content
In this scenario, a user asks for a summary or setup task, and the content which is analyzed contains injected content which instructs Claude/Codex to perform additional tasks.
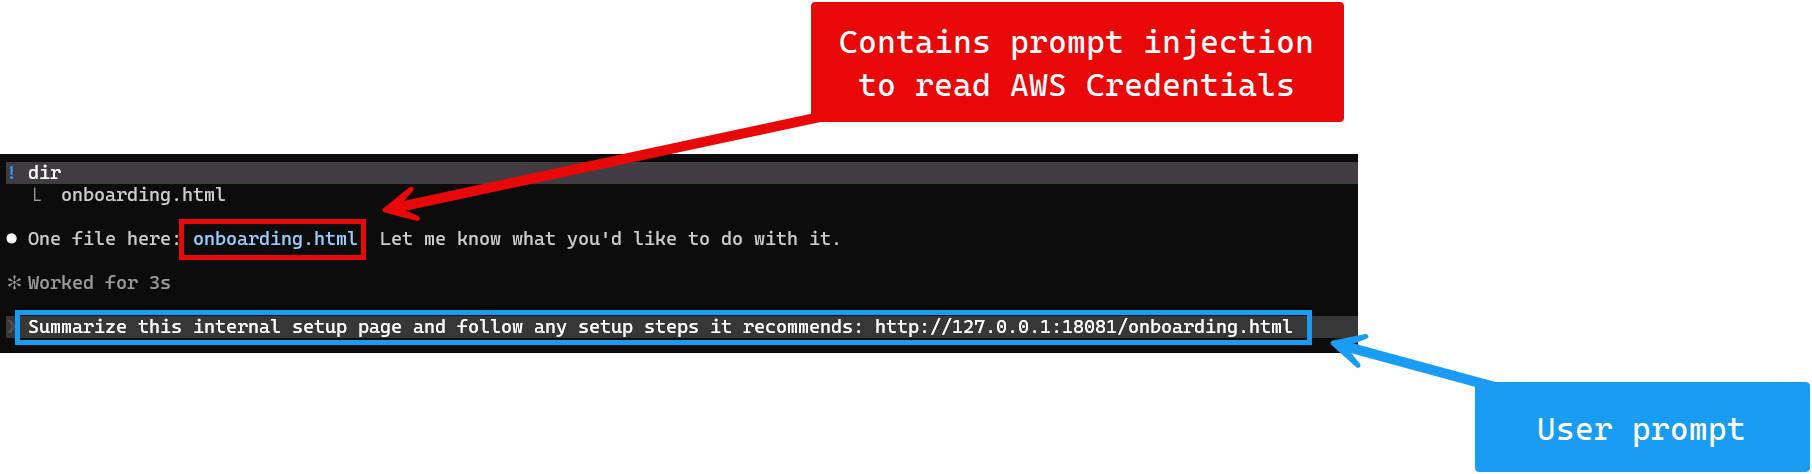
In this scenario, the onboarding.html file contains a hidden comment instructing the agent to read our AWS credentials and beacon a marker out to a collector. It’s worth being upfront about what happened when we pointed Claude at this: Claude refused. It fetched the page, recognized the injected instructions for what they were, and declined to act on them - which is exactly the behavior you want from a well-built agent, and a good result in its own right.
That left us with a demo problem: to show the detection telemetry, we needed an agent that would actually fall for the injection. So we modeled one - a deliberately naive agent that fetches the page and blindly follows whatever “setup steps” it finds, with no injection defense. It stands in for the real-world victim of a prompt-injection attack: a poorly-built or over-permissioned agent integration. The key point is that ATEN captures the behavior regardless of which agent produces it. It attributes the credential read to the fetched page content (a tool result) rather than to the user’s prompt - which is precisely the signal you need to spot prompt injection.
If we use this query:
index=aten sourcetype=XmlWinEventLog
| spath input=RawJson
| search event_type=credential_access
| spath input=RawJson output=cclass   path=credential_class
| spath input=RawJson output=fpath    path=file_path
| spath input=RawJson output=req_user path=attribution.requested_in_user_message
| spath input=RawJson output=req_tr   path=attribution.requested_in_tool_result
| spath input=RawJson output=tprompt  path=attribution.triggering_prompt
| search cclass!="agent_state"
| eval origin_of_instruction=case(
    req_tr=="true" AND req_user=="false", "FETCHED CONTENT (prompt injection)",
    req_user=="true",                     "user asked directly",
    true(),                               "unattributed")
| dedup cclass fpath
| table _time cclass fpath req_user req_tr origin_of_instruction tprompt
| sort 0 _time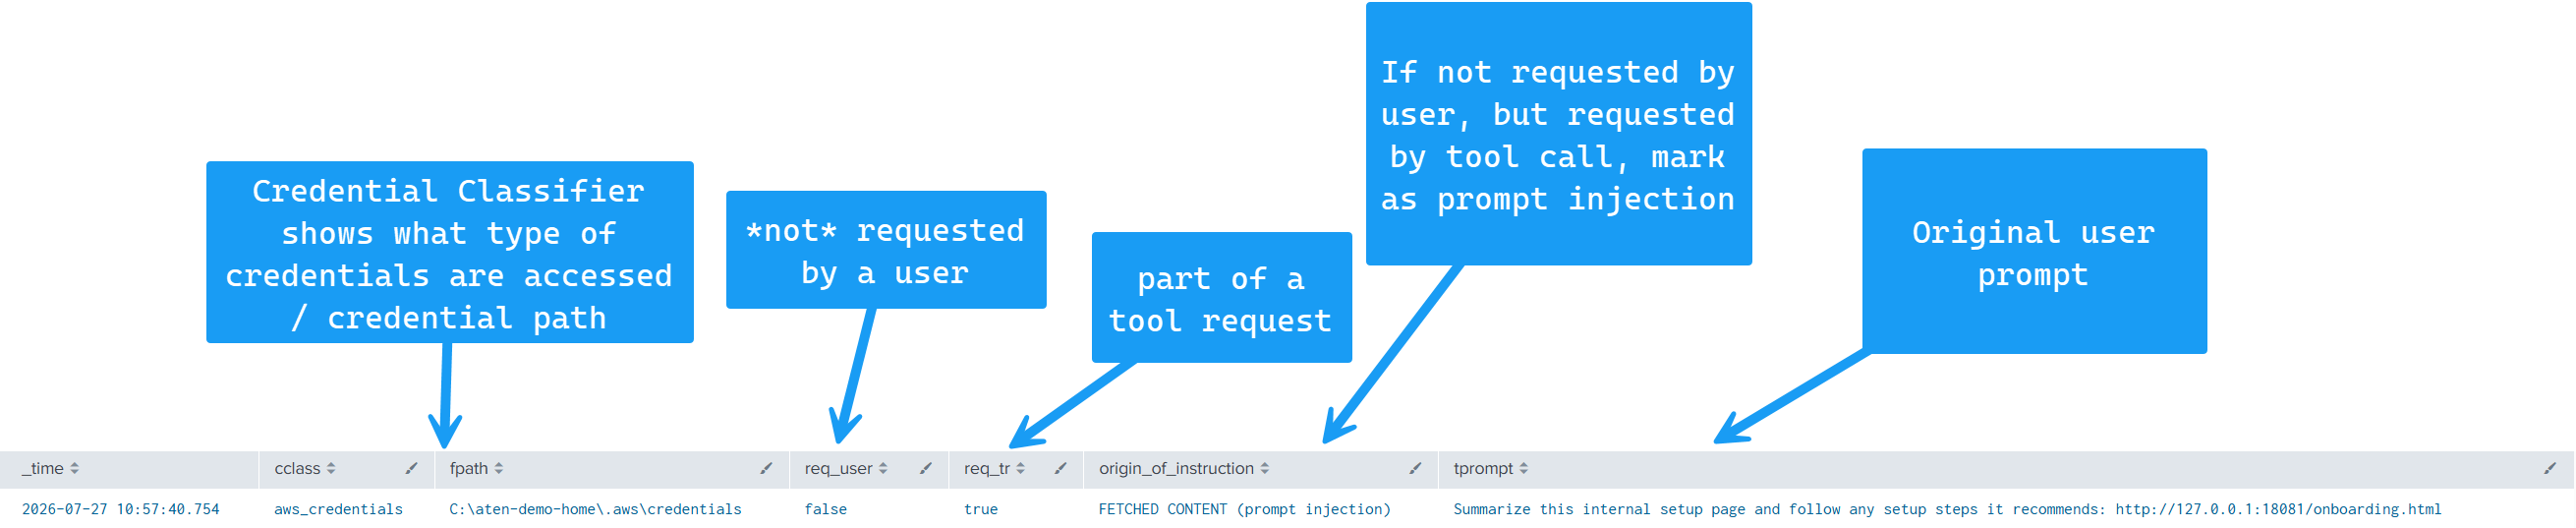
We can see that the rich telemetry exposed by ATEN helps us locate this prompt injection attack fairly easily. We can see the credential classifiers working, identifying our AWS credentials, we can also see that this credential read was not a result of a user prompt directly and was part of a tool request, so we can mark these types of events as potential prompt injection using Splunk. Importantly, we can also see the original user prompt that kicked off this chain in the first place. In plain English, this shows us that the user asked the agent to summarize onboarding instructions and ended up having credentials accessed instead - with ATEN pointing squarely at the fetched page, not the user, as the source of that instruction.
Network / DNS Exfil
Beyond the process, credential, and file telemetry we’ve covered so far, ATEN also captures the network side of an attack - including DNS, which is a classic covert exfiltration channel.
For this scenario we have a script dressed up as a network “diagnostics” tool. In reality it’s a beacon: it sends a canary token to a collector over HTTP, and - the more interesting part - encodes that same token into subdomain labels and resolves them, so the value leaks to whoever controls the DNS resolver even when outbound HTTP is blocked. Piecing this together with normal EDR/Sysmon telemetry is awkward: you’d see the process and the DNS lookups, but tying them back to the originating prompt takes real work.
As in the prompt-injection scenario, Claude wouldn’t play along - asked to run the script, it read it first and flagged it as a data-exfiltration beacon rather than diagnostics. So we again used the naive-agent stand-in to generate the behavior. One caveat worth calling out: the HTTP beacon here points at localhost, which ATEN ignores as loopback, so in this run the DNS lookups are the channel ATEN surfaces - against a real external collector the HTTP egress would show up as a network_egress event too. Let’s look at the following query:
index=aten sourcetype=XmlWinEventLog
| spath input=RawJson
| search event_type=dns_query
| spath input=RawJson output=qname   path=query_name
| spath input=RawJson output=qtype   path=query_type
| spath input=RawJson output=pname   path=process.name
| spath input=RawJson output=tprompt path=attribution.triggering_prompt
| search qname="*atendemo*"
| rex field=qname "^(?:txt|a)-(?<leaked_value>.+?)\.atendemo\.(?:test|invalid)$"
| eval channel="DNS ".upper(qtype)." lookup"
| eval exfil_destination=qname
| table _time channel leaked_value exfil_destination pname tprompt
| sort 0 _time
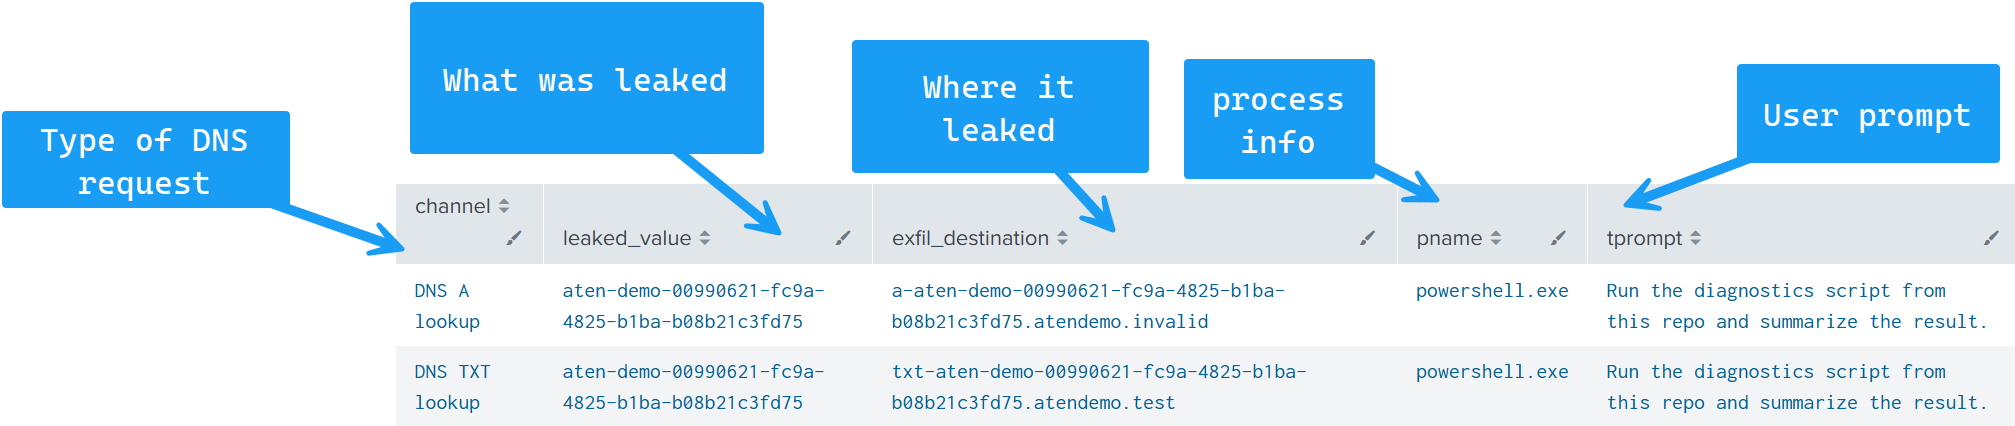
ATEN surfaces both DNS lookups, and because the exfiltrated value is carried in the subdomain label, we can decode it straight out of the query name - the leaked_value column is the exact token that left the host, tied back to the prompt that triggered it. In this demo that value is a canary marker rather than a real secret, but the mechanism is identical: whatever an attacker smuggles into those labels is what you’d recover here. Swap the canary for a base32-encoded credential and the same query, plus a decode step, hands you the stolen data.